
XAU/USD: gold prices are falling
11 June 2019, 09:24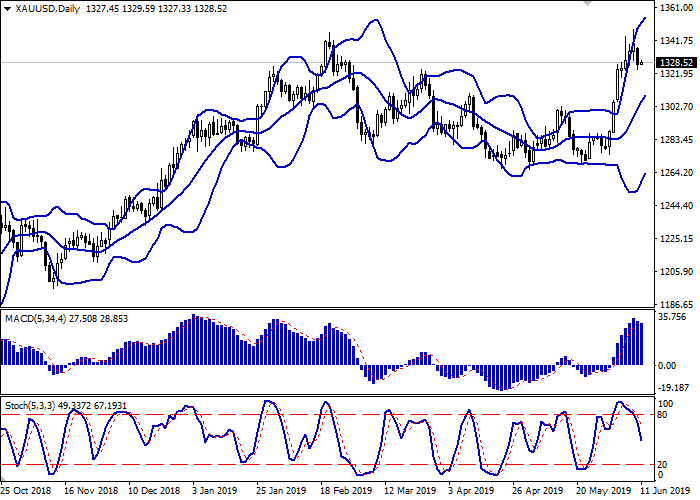
| Scenario | |
|---|---|
| Timeframe | Intraday |
| Recommendation | BUY STOP |
| Entry Point | 1334.10 |
| Take Profit | 1347.94 |
| Stop Loss | 1326.00 |
| Key Levels | 1306.17, 1312.52, 1318.31, 1324.83, 1334.00, 1339.48, 1343.75, 1347.94 |
| Alternative scenario | |
|---|---|
| Recommendation | SELL STOP |
| Entry Point | 1324.75 |
| Take Profit | 1306.17 |
| Stop Loss | 1330.00 |
| Key Levels | 1306.17, 1312.52, 1318.31, 1324.83, 1334.00, 1339.48, 1343.75, 1347.94 |
Current trend
Yesterday, gold prices began to decline, responding to the conclusion of an agreement on illegal migration between the US and Mexico. The document helped to avoid a new trade war and markedly reduced the overall tensions in the market. Now, investors are focused on US-China relations but there is no news on the issue expected until the start of the G20 summit in late June. However, gold is supported by the Fed’s willingness to lower interest rates. The US labor market report, published last Friday, was worse than expected again and reflected trouble spots in the American economy.
Today, investors expect the publication of US statistics on the dynamics of industrial inflation and an index of business optimism in May. More interesting data will be released on Wednesday when the US and China will publish May statistics on consumer inflation.
Support and resistance
On the daily chart, Bollinger bands grow steadily. The price range is slightly narrowed in response to the emergence of negative dynamics at the beginning of the week. The MACD reverses downwards, forming a sell signal (the histogram is trying to consolidate below the signal line). Stochastic reverses downwards, being approximately in the center of its working area.
The current readings of the indicators do not contradict the further decrease of the instrument in the short and/or ultra-short term.
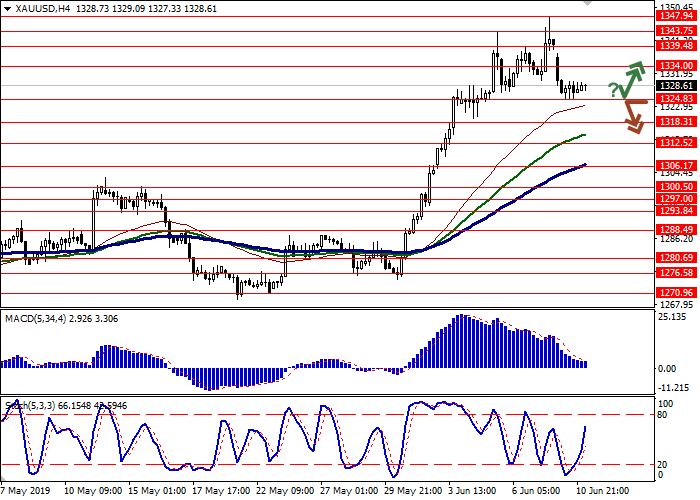
Resistance levels: 1334.00, 1339.48, 1343.75, 1347.94.
Support levels: 1324.83, 1318.31, 1312.52, 1306.17.

Trading tips
Long positions can be opened after a rebound from 1324.83 and a breakout of 1334.00 with the target at 1347.94. Stop loss is 1326.00. Implementation period: 1–2 days.
Short positions can be opened after the breakdown of 1324.83 with the target at 1306.17. Stop loss is 1330.00. Implementation period: 2–3 days.
Yesterday, gold prices began to decline, responding to the conclusion of an agreement on illegal migration between the US and Mexico. The document helped to avoid a new trade war and markedly reduced the overall tensions in the market. Now, investors are focused on US-China relations but there is no news on the issue expected until the start of the G20 summit in late June. However, gold is supported by the Fed’s willingness to lower interest rates. The US labor market report, published last Friday, was worse than expected again and reflected trouble spots in the American economy.
Today, investors expect the publication of US statistics on the dynamics of industrial inflation and an index of business optimism in May. More interesting data will be released on Wednesday when the US and China will publish May statistics on consumer inflation.
Support and resistance
On the daily chart, Bollinger bands grow steadily. The price range is slightly narrowed in response to the emergence of negative dynamics at the beginning of the week. The MACD reverses downwards, forming a sell signal (the histogram is trying to consolidate below the signal line). Stochastic reverses downwards, being approximately in the center of its working area.
The current readings of the indicators do not contradict the further decrease of the instrument in the short and/or ultra-short term.
Resistance levels: 1334.00, 1339.48, 1343.75, 1347.94.
Support levels: 1324.83, 1318.31, 1312.52, 1306.17.
Trading tips
Long positions can be opened after a rebound from 1324.83 and a breakout of 1334.00 with the target at 1347.94. Stop loss is 1326.00. Implementation period: 1–2 days.
Short positions can be opened after the breakdown of 1324.83 with the target at 1306.17. Stop loss is 1330.00. Implementation period: 2–3 days.


No comments:
Write comments