XAU/USD: gold prices are consolidating
28 June 2019, 09:34
| Scenario | |
|---|---|
| Timeframe | Intraday |
| Recommendation | BUY STOP |
| Entry Point | 1425.10, 1430.10 |
| Take Profit | 1465.00, 1480.00 |
| Stop Loss | 1400.00 |
| Key Levels | 1357.90, 1382.22, 1398.27, 1411.57, 1425.00, 1439.11, 1455.00 |
| Alternative scenario | |
|---|---|
| Recommendation | SELL STOP |
| Entry Point | 1399.95 |
| Take Profit | 1357.90, 1347.94 |
| Stop Loss | 1425.00 |
| Key Levels | 1357.90, 1382.22, 1398.27, 1411.57, 1425.00, 1439.11, 1455.00 |
Current trend
Yesterday, gold prices declined as interest in risk in the market continued to grow accordingly to the expectations of a favorable outcome of trade negotiations between the United States and China at the G20 summit. At the same time, closer to the end of the daily session, the instrument managed to regain almost all of its losses, and today, during the Asian session, the course is moving within a steady upward trend.
The quotes are supported by the Fed's soft monetary policy. It is predicted that the regulator may lower the rate during the July meeting but much will depend on the updated economic data.
Support and resistance
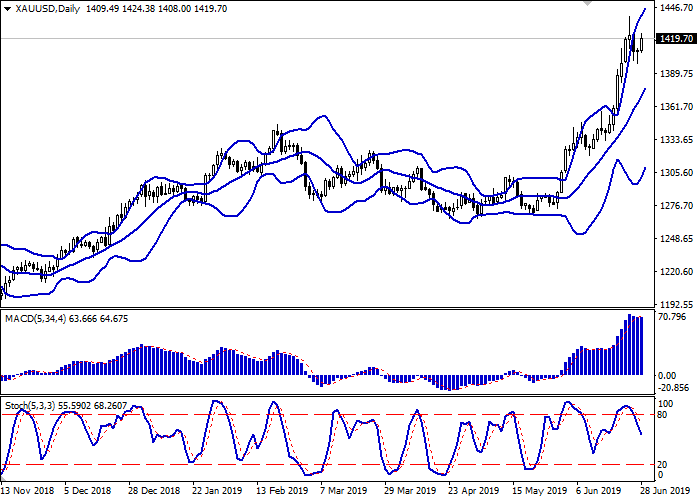
Bollinger bands are growing steadily on the daily chart. The price range narrows but still remains spacious enough for the current level of activity in the market. The MACD indicator is trying to reverse downwards and form a new sell signal (the histogram should be located below the signal line). Stochastic is moving within a more confident downward trend and practically does not respond to the resumption of growth during today's Asian session.
It is better to wait for clarification of the situation and the emergence of clearer trading signals from the indicators.
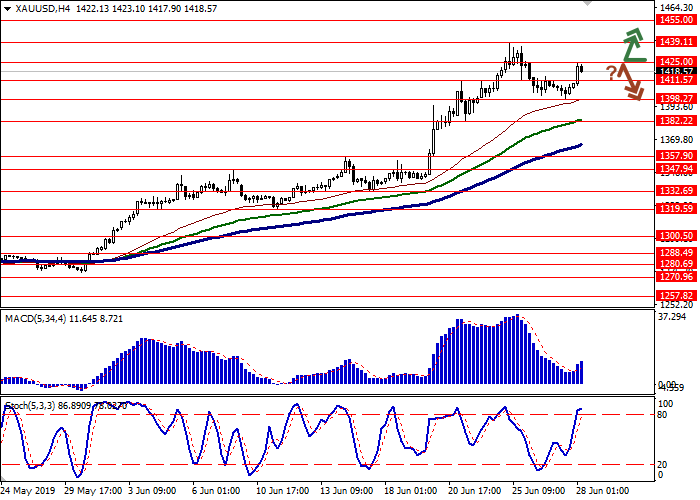
Resistance levels: 1425.00, 1439.11, 1455.00.
Support levels: 1411.57, 1398.27, 1382.22, 1357.90.


Trading tips
Long positions can be opened after the breakout of the level of 1425.00 or 1430.00 with the target at 1465.00 or 1480.00. Stop loss is 1400.00.
Short positions can be opened after a rebound from the level of 1425.00 and a breakdown of the level of 1400.00 with the target at 1357.90 or 1347.94. Stop loss is 1425.00.
Implementation period: 2–3 days.
Yesterday, gold prices declined as interest in risk in the market continued to grow accordingly to the expectations of a favorable outcome of trade negotiations between the United States and China at the G20 summit. At the same time, closer to the end of the daily session, the instrument managed to regain almost all of its losses, and today, during the Asian session, the course is moving within a steady upward trend.
The quotes are supported by the Fed's soft monetary policy. It is predicted that the regulator may lower the rate during the July meeting but much will depend on the updated economic data.
Support and resistance
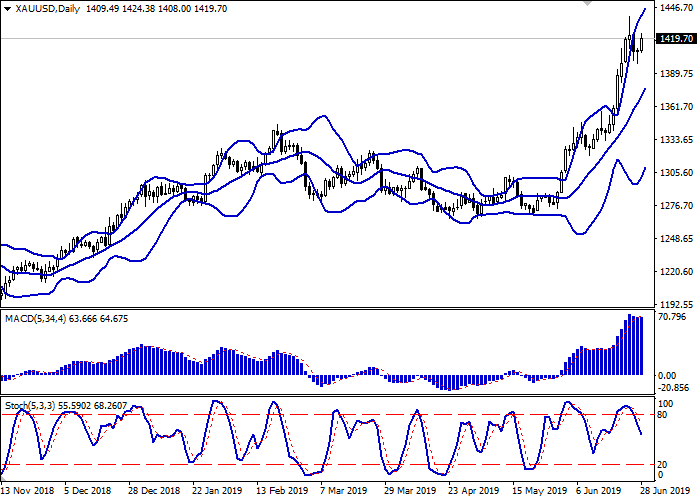
Bollinger bands are growing steadily on the daily chart. The price range narrows but still remains spacious enough for the current level of activity in the market. The MACD indicator is trying to reverse downwards and form a new sell signal (the histogram should be located below the signal line). Stochastic is moving within a more confident downward trend and practically does not respond to the resumption of growth during today's Asian session.
It is better to wait for clarification of the situation and the emergence of clearer trading signals from the indicators.
Resistance levels: 1425.00, 1439.11, 1455.00.
Support levels: 1411.57, 1398.27, 1382.22, 1357.90.


Trading tips
Long positions can be opened after the breakout of the level of 1425.00 or 1430.00 with the target at 1465.00 or 1480.00. Stop loss is 1400.00.
Short positions can be opened after a rebound from the level of 1425.00 and a breakdown of the level of 1400.00 with the target at 1357.90 or 1347.94. Stop loss is 1425.00.
Implementation period: 2–3 days.


No comments:
Write comments