XAU/USD: gold is growing
03 June 2019, 09:49
| Scenario | |
|---|---|
| Timeframe | Intraday |
| Recommendation | BUY STOP |
| Entry Point | 1312.60 |
| Take Profit | 1324.35 |
| Stop Loss | 1306.17 |
| Key Levels | 1293.84, 1297.00, 1300.50, 1306.17, 1312.52, 1318.31, 1324.35 |
| Alternative scenario | |
|---|---|
| Recommendation | SELL STOP |
| Entry Point | 1306.10 |
| Take Profit | 1293.84, 1288.49 |
| Stop Loss | 1315.00 |
| Key Levels | 1293.84, 1297.00, 1300.50, 1306.17, 1312.52, 1318.31, 1324.35 |
Current trend
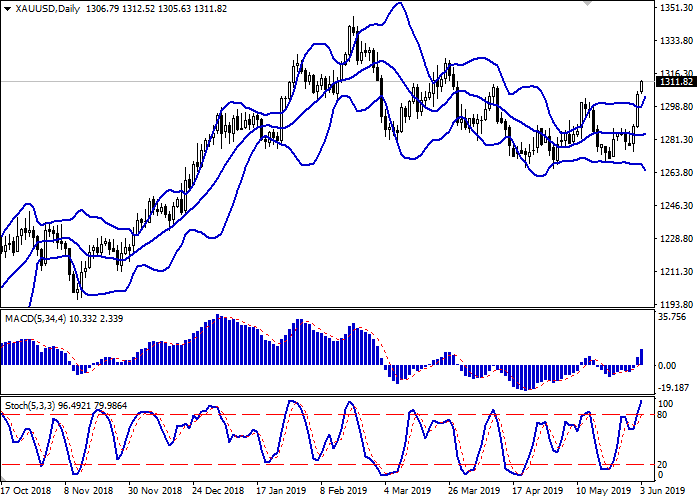
At the end of the last trading week, gold prices rose substantially, renewing the highs since the end of March this year. Strengthening the instrument was a response of the market to the promises of Donald Trump to introduce import duties on all Mexican goods if Mexico does not restrict the flow of illegal migrants. Taxes can be introduced as early as June 10th. Investors are extremely sensitive to such Trump’s statements because the new import duties threaten a significant slowdown in global economic growth and the possible development of a recession.
The price is additionally supported by increased expectations of the Fed’s interest rates decrease. The latest macroeconomic data from the United States indicated a further weakening of a number of sectors of the American economy, so investors try to avoid risk more.
Support and resistance
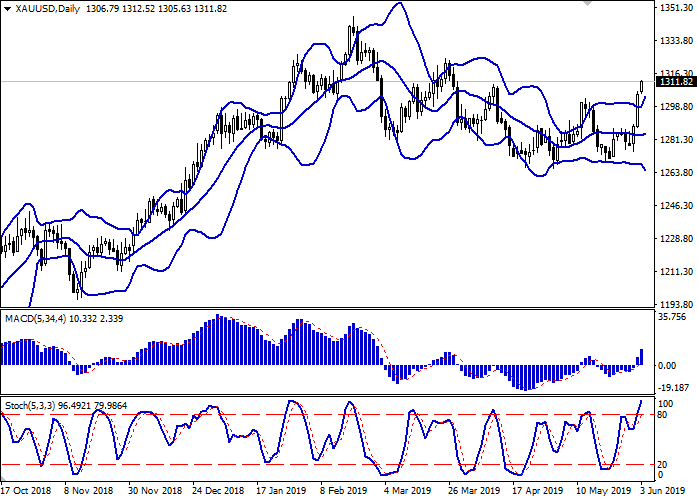
On the daily chart, Bollinger bands move flat. The price range actively expands but not as fast as the "bullish" sentiment develops. The MACD is growing, keeping a strong buy signal (the histogram is above the signal line). Stochastic is directed upwards but is close to its highs, which indicates that the instrument may be overbought in the super short term.
It is better to keep current long positions and wait for additional signals from the indicators before opening new positions.
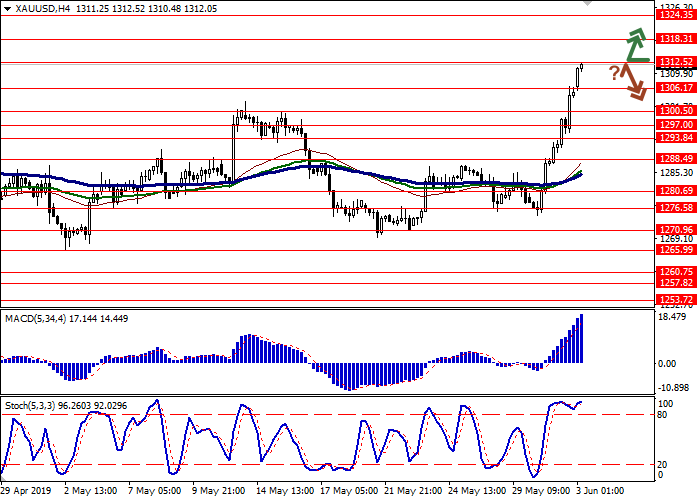
Resistance levels: 1312.52, 1318.31, 1324.35.
Support levels: 1306.17, 1300.50, 1297.00, 1293.84.


Trading tips
Long positions can be opened after the breakout of 1312.52 with the target at 1324.35. Stop loss is 1306.17. Implementation period: 1–2 days.
Short positions can be opened after a rebound from 1312.52 and the breakdown of 1306.17 with the target at 1293.84 or 1288.49. Stop loss is 1315.00. Implementation period: 2–3 days.
At the end of the last trading week, gold prices rose substantially, renewing the highs since the end of March this year. Strengthening the instrument was a response of the market to the promises of Donald Trump to introduce import duties on all Mexican goods if Mexico does not restrict the flow of illegal migrants. Taxes can be introduced as early as June 10th. Investors are extremely sensitive to such Trump’s statements because the new import duties threaten a significant slowdown in global economic growth and the possible development of a recession.
The price is additionally supported by increased expectations of the Fed’s interest rates decrease. The latest macroeconomic data from the United States indicated a further weakening of a number of sectors of the American economy, so investors try to avoid risk more.
Support and resistance
On the daily chart, Bollinger bands move flat. The price range actively expands but not as fast as the "bullish" sentiment develops. The MACD is growing, keeping a strong buy signal (the histogram is above the signal line). Stochastic is directed upwards but is close to its highs, which indicates that the instrument may be overbought in the super short term.
It is better to keep current long positions and wait for additional signals from the indicators before opening new positions.
Resistance levels: 1312.52, 1318.31, 1324.35.
Support levels: 1306.17, 1300.50, 1297.00, 1293.84.


Trading tips
Long positions can be opened after the breakout of 1312.52 with the target at 1324.35. Stop loss is 1306.17. Implementation period: 1–2 days.
Short positions can be opened after a rebound from 1312.52 and the breakdown of 1306.17 with the target at 1293.84 or 1288.49. Stop loss is 1315.00. Implementation period: 2–3 days.


No comments:
Write comments