XAU/USD: general analysis
13 June 2019, 11:03
| Scenario | |
|---|---|
| Timeframe | Intraday |
| Recommendation | BUY STOP |
| Entry Point | 1340.10 |
| Take Profit | 1347.60 |
| Stop Loss | 1332.50 |
| Key Levels | 1261.21, 1266.08, 1227.45, 1281.69, 1288.09, 1297.17, 1304.60 |
| Alternative scenario | |
|---|---|
| Recommendation | SELL STOP |
| Entry Point | 1329.95 |
| Take Profit | 1320.30, 1319.50 |
| Stop Loss | 1334.20 |
| Key Levels | 1261.21, 1266.08, 1227.45, 1281.69, 1288.09, 1297.17, 1304.60 |
Current trend
Gold continues to trade near the highs of 2019.
This week, the instrument was supported by poor US inflation releases. The reduction in price pressure may force the Fed to lower the key rate at the next Committee meeting. In addition, yesterday, US President Donald Trump acknowledged the existence of significant obstacles to an agreement with Beijing, which led to an increase in demand for precious metals. The trade conflict is already having a negative impact on the economies of China and the United States, and recent macroeconomic data confirm it. In this regard, gold is once again perceived by investors as a shelter asset and has a high potential for growth.
Today at 14:30 (GMT+2), the publication of data on the US labor market is expected. Tomorrow at 14:30 (GMT+2), there will be statistics on Retail Sales, and at 15:15 (GMT+2) Industrial Production data will be published. The releases can cause strong market volatility.
Support and resistance
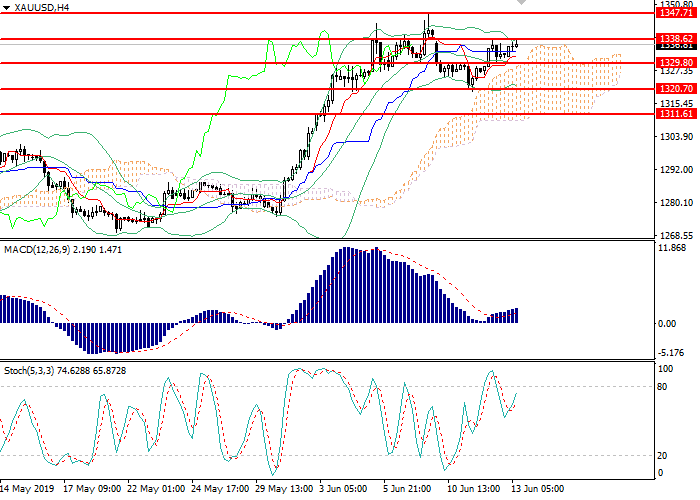
On the 4-hour chart, the instrument is trading at the upper border of Bollinger bands. The indicator is directed downwards, and the price range has expanded significantly, indicating a continuation of the fall. The MACD histogram is in the negative zone, keeping a strong sell signal. Stochastic entered the oversold area; a strong buy signal can be formed within 1–2 days.
Resistance levels: 1281.69, 1288.09, 1297.17, 1304.60.
Support levels: 1227.45, 1266.08, 1261.21.

Trading tips
Long positions can be opened above the level of 1340.00 with the target at 1347.60 and stop loss 1332.50.
Short positions can be opened below the level of 1330.00 with the targets at 1320.30, 1319.50 and stop loss 1334.20.
Implementation period: 1–2 days.
Gold continues to trade near the highs of 2019.
This week, the instrument was supported by poor US inflation releases. The reduction in price pressure may force the Fed to lower the key rate at the next Committee meeting. In addition, yesterday, US President Donald Trump acknowledged the existence of significant obstacles to an agreement with Beijing, which led to an increase in demand for precious metals. The trade conflict is already having a negative impact on the economies of China and the United States, and recent macroeconomic data confirm it. In this regard, gold is once again perceived by investors as a shelter asset and has a high potential for growth.
Today at 14:30 (GMT+2), the publication of data on the US labor market is expected. Tomorrow at 14:30 (GMT+2), there will be statistics on Retail Sales, and at 15:15 (GMT+2) Industrial Production data will be published. The releases can cause strong market volatility.
Support and resistance
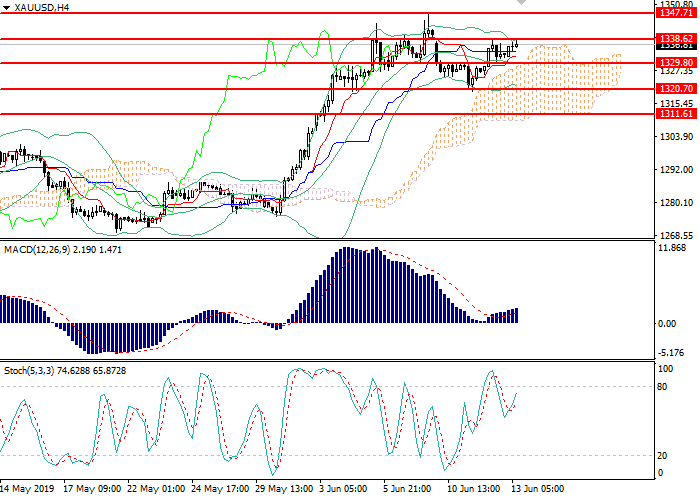
On the 4-hour chart, the instrument is trading at the upper border of Bollinger bands. The indicator is directed downwards, and the price range has expanded significantly, indicating a continuation of the fall. The MACD histogram is in the negative zone, keeping a strong sell signal. Stochastic entered the oversold area; a strong buy signal can be formed within 1–2 days.
Resistance levels: 1281.69, 1288.09, 1297.17, 1304.60.
Support levels: 1227.45, 1266.08, 1261.21.

Trading tips
Long positions can be opened above the level of 1340.00 with the target at 1347.60 and stop loss 1332.50.
Short positions can be opened below the level of 1330.00 with the targets at 1320.30, 1319.50 and stop loss 1334.20.
Implementation period: 1–2 days.


No comments:
Write comments