XAG/USD: silver prices are consolidating
06 June 2019, 09:49
| Scenario | |
|---|---|
| Timeframe | Intraday |
| Recommendation | BUY |
| Entry Point | 14.83 |
| Take Profit | 15.00 |
| Stop Loss | 14.74 |
| Key Levels | 14.53, 14.65, 14.72, 14.76, 14.82, 14.90, 15.00 |
| Alternative scenario | |
|---|---|
| Recommendation | SELL STOP |
| Entry Point | 14.70 |
| Take Profit | 14.53 |
| Stop Loss | 14.80 |
| Key Levels | 14.53, 14.65, 14.72, 14.76, 14.82, 14.90, 15.00 |
Current trend
Yesterday, silver prices renewed its highs since the end of April but failed to consolidate there, as USD rose within the correction across virtually the entire spectrum of the market. The quotes are still supported by significant threats to the expansion of US trade wars with China, the EU, and Mexico. Yesterday, Donald Trump confirmed his intention to introduce import duties on all Mexican goods from June 10. Additional pressure on the dollar provides the possibility that the Fed will decrease interest rates, which is recently actively spoken by representatives of the regulator.
Support and resistance
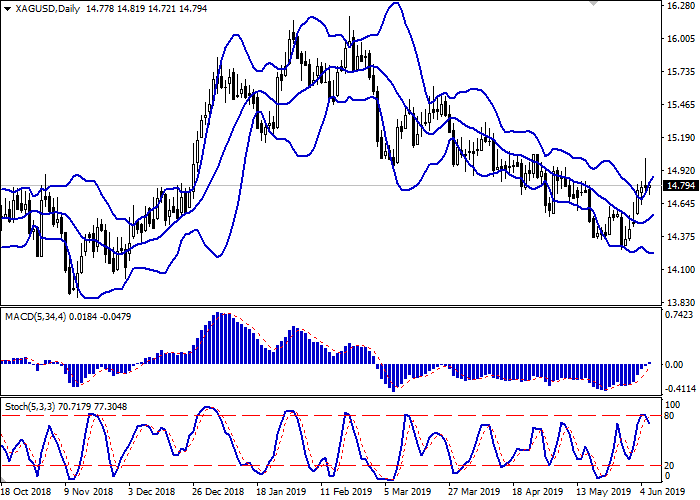
On the daily chart, Bollinger bands are growing moderately. The price range is actively expanding from above, reflecting the prospects for the development of upward dynamics in the short term. The MACD indicator is growing, keeping a moderate buy signal (the histogram is above the signal line), and is trying to consolidate above the zero line. Stochastic, reaching 80, reversed into a downwards plane, responding to the uncertain nature of trading on Wednesday.
It is better to wait for clarification of the situation and trading signals from technical indicators.
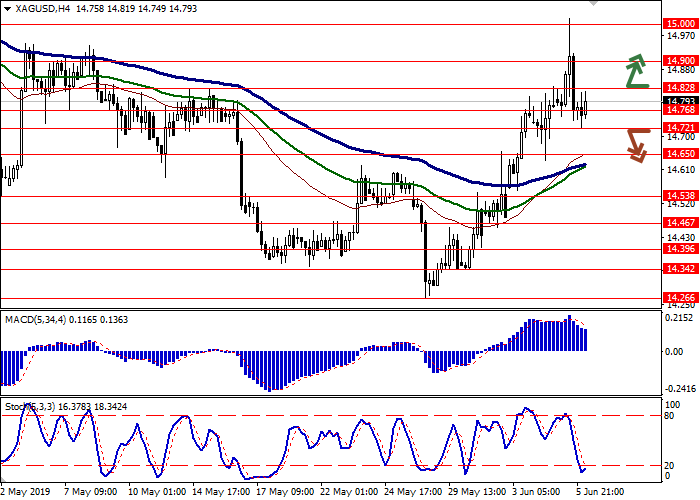
Resistance levels: 14.82, 14.90, 15.00.
Support levels: 14.76, 14.72, 14.65, 14.53.


Trading tips
Long positions can be opened after the breakout of the level of 14.82 with the target at 15.00. Stop loss is 14.74.
Short positions can be opened after the breakdown of the level of 14.72 with the target at 14.53. Stop loss is 14.80.
Implementation period: 2–3 days.
Yesterday, silver prices renewed its highs since the end of April but failed to consolidate there, as USD rose within the correction across virtually the entire spectrum of the market. The quotes are still supported by significant threats to the expansion of US trade wars with China, the EU, and Mexico. Yesterday, Donald Trump confirmed his intention to introduce import duties on all Mexican goods from June 10. Additional pressure on the dollar provides the possibility that the Fed will decrease interest rates, which is recently actively spoken by representatives of the regulator.
Support and resistance
On the daily chart, Bollinger bands are growing moderately. The price range is actively expanding from above, reflecting the prospects for the development of upward dynamics in the short term. The MACD indicator is growing, keeping a moderate buy signal (the histogram is above the signal line), and is trying to consolidate above the zero line. Stochastic, reaching 80, reversed into a downwards plane, responding to the uncertain nature of trading on Wednesday.
It is better to wait for clarification of the situation and trading signals from technical indicators.
Resistance levels: 14.82, 14.90, 15.00.
Support levels: 14.76, 14.72, 14.65, 14.53.


Trading tips
Long positions can be opened after the breakout of the level of 14.82 with the target at 15.00. Stop loss is 14.74.
Short positions can be opened after the breakdown of the level of 14.72 with the target at 14.53. Stop loss is 14.80.
Implementation period: 2–3 days.


No comments:
Write comments