
EUR/USD: EUR is trading in both directions
06 June 2019, 10:02
| Scenario | |
|---|---|
| Timeframe | Intraday |
| Recommendation | BUY STOP |
| Entry Point | 1.1245, 1.1255 |
| Take Profit | 1.1305 |
| Stop Loss | 1.1220 |
| Key Levels | 1.1133, 1.1165, 1.1198, 1.1217, 1.1250, 1.1263, 1.1285, 1.1305 |
| Alternative scenario | |
|---|---|
| Recommendation | SELL STOP |
| Entry Point | 1.1210 |
| Take Profit | 1.1165, 1.1150 |
| Stop Loss | 1.1240 |
| Key Levels | 1.1133, 1.1165, 1.1198, 1.1217, 1.1250, 1.1263, 1.1285, 1.1305 |
Current trend
EUR showed ambiguous trading against USD on Wednesday. In the morning, EUR was trading higher and the instrument was able to update its local highs of April 17, but then traders began to actively get rid of long positions, which caused a significant pullback. The negative dynamics was due to the aggravation of relations between the Italian government and the EU due to the large fine Italy faces for the excess of public debt, which amounted to more than 130%.
Wednesday's macroeconomic statistics from euro area supported the instrument moderately. Markit Services PMI in May increased from 52.8 to 52.9 points with the forecast of the decline to 52.5 points. Composite PMI for the same period strengthened from 51.5 to 51.8 points, which exceeded expectations of 51.6 points.
Support and resistance
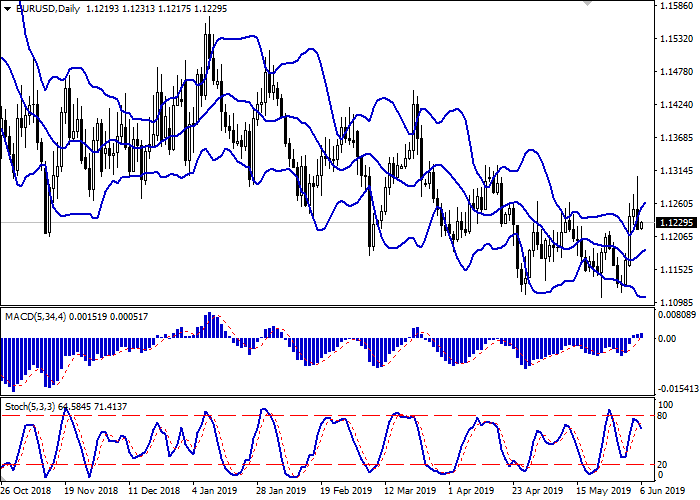
Bollinger Bands in D1 chart show moderate growth. The price range expands from above, freeing the path for the "bulls" to develop uptrend in the short term. MACD indicator is growing, keeping a stable buy signal (located above the signal line). Moreover, the indicator is still located above the zero level. Stochastic reversed downwards near the "80" level and currently reflects the risks of a corrective decline in the ultra-short term.
To open new trading positions, one should wait for the situation to clear up.
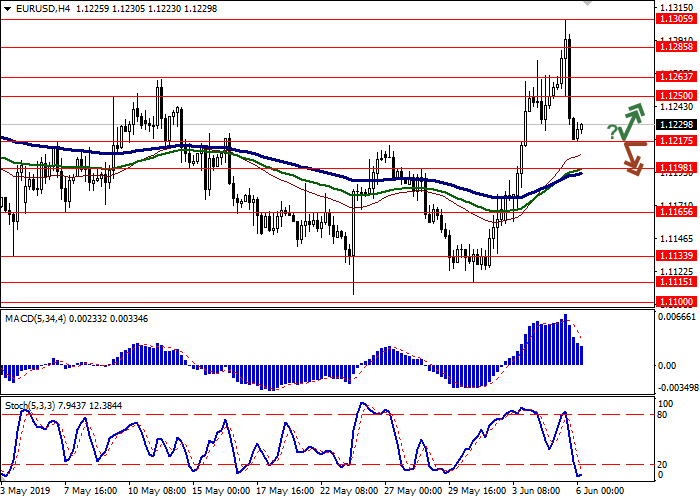
Resistance levels: 1.1250, 1.1263, 1.1285, 1.1305.
Support levels: 1.1217, 1.1198, 1.1165, 1.1133.
Trading tips
To open long positions, one can rely on the rebound from the support level of 1.1217 with the subsequent breakout of 1.1240–1.1250. Take profit — 1.1305. Stop loss — 1.1220.
The breakdown of 1.1217 may serve as a signal to new sales with the targets at 1.1165–1.1150. Stop loss — 1.1240.
Implementation time: 2-3 days.
EUR showed ambiguous trading against USD on Wednesday. In the morning, EUR was trading higher and the instrument was able to update its local highs of April 17, but then traders began to actively get rid of long positions, which caused a significant pullback. The negative dynamics was due to the aggravation of relations between the Italian government and the EU due to the large fine Italy faces for the excess of public debt, which amounted to more than 130%.
Wednesday's macroeconomic statistics from euro area supported the instrument moderately. Markit Services PMI in May increased from 52.8 to 52.9 points with the forecast of the decline to 52.5 points. Composite PMI for the same period strengthened from 51.5 to 51.8 points, which exceeded expectations of 51.6 points.
Support and resistance
Bollinger Bands in D1 chart show moderate growth. The price range expands from above, freeing the path for the "bulls" to develop uptrend in the short term. MACD indicator is growing, keeping a stable buy signal (located above the signal line). Moreover, the indicator is still located above the zero level. Stochastic reversed downwards near the "80" level and currently reflects the risks of a corrective decline in the ultra-short term.
To open new trading positions, one should wait for the situation to clear up.
Resistance levels: 1.1250, 1.1263, 1.1285, 1.1305.
Support levels: 1.1217, 1.1198, 1.1165, 1.1133.
Trading tips
To open long positions, one can rely on the rebound from the support level of 1.1217 with the subsequent breakout of 1.1240–1.1250. Take profit — 1.1305. Stop loss — 1.1220.
The breakdown of 1.1217 may serve as a signal to new sales with the targets at 1.1165–1.1150. Stop loss — 1.1240.
Implementation time: 2-3 days.


No comments:
Write comments