WTI Crude Oil: oil prices are falling
18 June 2019, 10:13
| Scenario | |
|---|---|
| Timeframe | Intraday |
| Recommendation | BUY STOP |
| Entry Point | 52.55 |
| Take Profit | 55.64, 57.00 |
| Stop Loss | 51.00 |
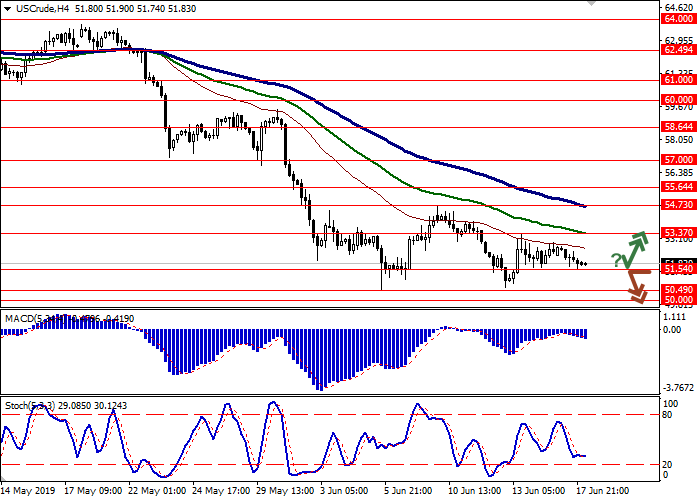
| Key Levels | 50.00, 50.49, 51.54, 53.37, 54.73, 55.64, 57.00 |
| Alternative scenario | |
|---|---|
| Recommendation | SELL STOP |
| Entry Point | 51.50 |
| Take Profit | 50.00, 49.50 |
| Stop Loss | 52.50 |
| Key Levels | 50.00, 50.49, 51.54, 53.37, 54.73, 55.64, 57.00 |
Current trend
Yesterday, oil prices fell slightly, as investors focused on the prospects for a slowdown in the global economy and a further decline in demand for petroleum products. Industrial production in China is falling at a record pace and is already at its lowest level of 17 years. Prospects for the normalization of trade relations between the United States and China remain vague, although investors are optimistic about the beginning of the G20 summit in late June. Interruptions in oil supplies due to the tense situation in the Middle East, as well as OPEC+ policies aimed at curbing the growth of oil and oil products, continue to support the prices moderately. Today, investors are focused on the report of the American Petroleum Institute on oil reserves for the week of June 14.
Support and resistance
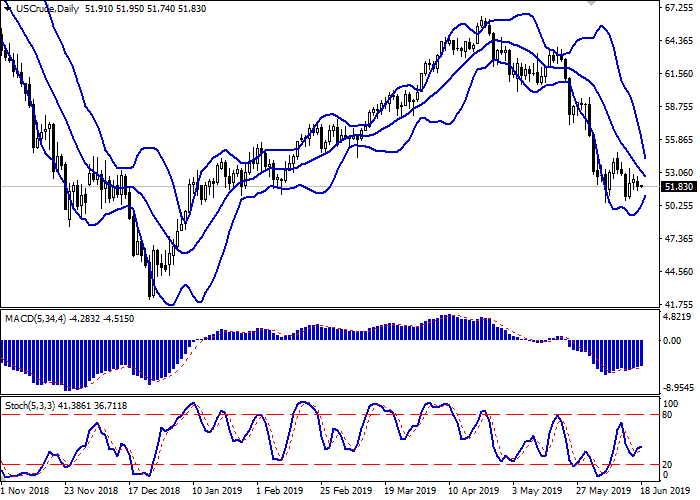
On the daily chart, Bollinger bands actively fall. The price range rapidly narrows, reflecting the emergence of ambiguous dynamics in the short term. The MACD grows, keeping a poor buy signal (the histogram is above the signal line). Stochastic is pointed upwards, being approximately in the center of its working area, which indicates the prospects for the development of corrective growth in the super-short term.
The restoration of "bullish" dynamics in the short and/or super short term is possible.
Resistance levels: 53.37, 54.73, 55.64, 57.00.
Support levels: 51.54, 50.49, 50.00.


Trading tips
Long positions can be opened after the rebound from 51.54 and the breakout of 52.50 with the target at 55.64 or 57.00. Stop loss is 51.00. Implementation period: 2–3 days.
Short positions can be opened after the breakdown of 51.54 with the target at 50.00 or 49.50. Stop loss is 52.50. Implementation period: 1–2 days.
Yesterday, oil prices fell slightly, as investors focused on the prospects for a slowdown in the global economy and a further decline in demand for petroleum products. Industrial production in China is falling at a record pace and is already at its lowest level of 17 years. Prospects for the normalization of trade relations between the United States and China remain vague, although investors are optimistic about the beginning of the G20 summit in late June. Interruptions in oil supplies due to the tense situation in the Middle East, as well as OPEC+ policies aimed at curbing the growth of oil and oil products, continue to support the prices moderately. Today, investors are focused on the report of the American Petroleum Institute on oil reserves for the week of June 14.
Support and resistance
On the daily chart, Bollinger bands actively fall. The price range rapidly narrows, reflecting the emergence of ambiguous dynamics in the short term. The MACD grows, keeping a poor buy signal (the histogram is above the signal line). Stochastic is pointed upwards, being approximately in the center of its working area, which indicates the prospects for the development of corrective growth in the super-short term.
The restoration of "bullish" dynamics in the short and/or super short term is possible.
Resistance levels: 53.37, 54.73, 55.64, 57.00.
Support levels: 51.54, 50.49, 50.00.


Trading tips
Long positions can be opened after the rebound from 51.54 and the breakout of 52.50 with the target at 55.64 or 57.00. Stop loss is 51.00. Implementation period: 2–3 days.
Short positions can be opened after the breakdown of 51.54 with the target at 50.00 or 49.50. Stop loss is 52.50. Implementation period: 1–2 days.


No comments:
Write comments