EUR/USD: euro is in correction
18 June 2019, 10:05
| Scenario | |
|---|---|
| Timeframe | Intraday |
| Recommendation | BUY STOP |
| Entry Point | 1.1250 |
| Take Profit | 1.1305, 1.1322 |
| Stop Loss | 1.1217 |
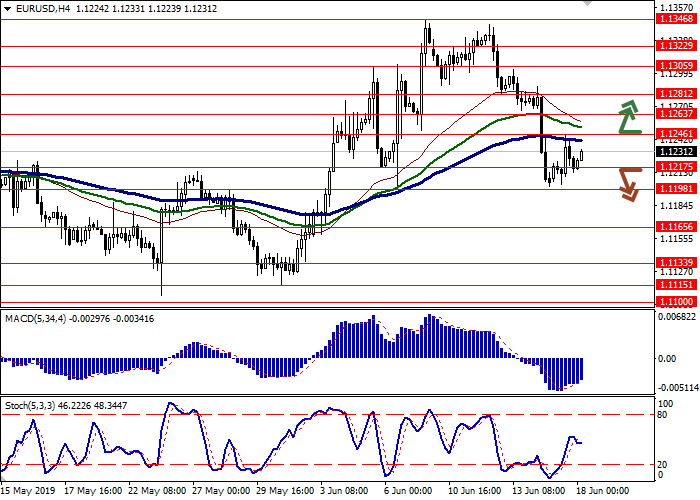
| Key Levels | 1.1133, 1.1165, 1.1198, 1.1217, 1.1246, 1.1263, 1.1281, 1.1305 |
| Alternative scenario | |
|---|---|
| Recommendation | SELL STOP |
| Entry Point | 1.1210, 1.1190 |
| Take Profit | 1.1133, 1.1115, 1.1100 |
| Stop Loss | 1.1230, 1.1250 |
| Key Levels | 1.1133, 1.1165, 1.1198, 1.1217, 1.1246, 1.1263, 1.1281, 1.1305 |
Current trend
On Monday, EUR against USD rose within the correction, recovering from a sharp decline at the end of the last trading week. The strengthening of the instrument is due to technical factors since investors are in no hurry to open new positions until the Fed’s meeting on Wednesday. Traders are waiting for comments regarding monetary easing in the near future. During the June meeting, the rate cut is doubtful but in July it looks quite likely. Today, during the Asian session, EUR is also trading in an upward manner. On Tuesday, investors expect the publication of a block of EU statistics on consumer inflation and economic sentiment. The market will also pay attention to the speech of the ECB President Mario Draghi and comments from other representatives of the Central Bank.
Support and resistance
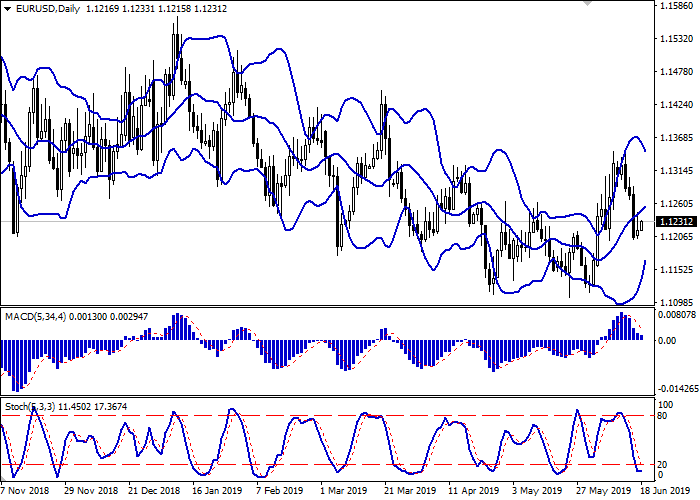
Bollinger bands are actively growing on the daily chart. The price range is rapidly narrowing, reflecting the emergence of a confident “bearish” dynamics last week. The MACD indicator is falling, keeping a relatively strong sell signal (the histogram is below the signal line). Stochastic, approaching its lows, reversed into a horizontal plane, responding to the appearance of corrective growth at the beginning of the current trading week.
The further development of correctional growth in the super-short term is possible.
Resistance levels: 1.1246, 1.1263, 1.1281, 1.1305.
Support levels: 1.1217, 1.1198, 1.1165, 1.1133.


Trading tips
Long positions can be opened after the breakout of the level of 1.1246 with the target at 1.1305 or 1.1322. Stop loss is 1.1217.
Short positions can be opened after the breakdown of the level of 1.1217 or 1.1198 with the targets of 1.1133 or 1.1115–1.1100. Stop loss is 1.1230–1.1250.
Implementation period: 2–3 days.
On Monday, EUR against USD rose within the correction, recovering from a sharp decline at the end of the last trading week. The strengthening of the instrument is due to technical factors since investors are in no hurry to open new positions until the Fed’s meeting on Wednesday. Traders are waiting for comments regarding monetary easing in the near future. During the June meeting, the rate cut is doubtful but in July it looks quite likely. Today, during the Asian session, EUR is also trading in an upward manner. On Tuesday, investors expect the publication of a block of EU statistics on consumer inflation and economic sentiment. The market will also pay attention to the speech of the ECB President Mario Draghi and comments from other representatives of the Central Bank.
Support and resistance
Bollinger bands are actively growing on the daily chart. The price range is rapidly narrowing, reflecting the emergence of a confident “bearish” dynamics last week. The MACD indicator is falling, keeping a relatively strong sell signal (the histogram is below the signal line). Stochastic, approaching its lows, reversed into a horizontal plane, responding to the appearance of corrective growth at the beginning of the current trading week.
The further development of correctional growth in the super-short term is possible.
Resistance levels: 1.1246, 1.1263, 1.1281, 1.1305.
Support levels: 1.1217, 1.1198, 1.1165, 1.1133.


Trading tips
Long positions can be opened after the breakout of the level of 1.1246 with the target at 1.1305 or 1.1322. Stop loss is 1.1217.
Short positions can be opened after the breakdown of the level of 1.1217 or 1.1198 with the targets of 1.1133 or 1.1115–1.1100. Stop loss is 1.1230–1.1250.
Implementation period: 2–3 days.


No comments:
Write comments