
USD/JPY: the instrument is consolidating
11 June 2019, 09:51
| Scenario | |
|---|---|
| Timeframe | Intraday |
| Recommendation | BUY STOP |
| Entry Point | 108.75 |
| Take Profit | 109.30, 109.50 |
| Stop Loss | 108.40 |
| Key Levels | 107.80, 108.06, 108.30, 108.70, 109.00, 109.30, 109.76 |
| Alternative scenario | |
|---|---|
| Recommendation | SELL STOP |
| Entry Point | 108.45, 108.35 |
| Take Profit | 107.80, 107.70 |
| Stop Loss | 108.70, 108.80 |
| Key Levels | 107.80, 108.06, 108.30, 108.70, 109.00, 109.30, 109.76 |
Current trend
USD showed ambiguous dynamics against JPY on Monday, ending the day session with almost zero result. USD was supported by optimistic news about the signing of an agreement between the USA and Mexico, which made it possible to avoid imposing import duties on Mexican goods from June 10. Investors also hoped that the US would be able to make some progress in trade negotiations with China.
In turn, the yen received strong support from macroeconomic publications from Japan. Japan's GDP in Q1 2019 showed an increase of 0.6% QoQ after a growth of 0.5% QoQ over the previous period. In annual terms, the growth of the Japanese economy in Q1 2019 reached +2.2% YoY after rising by 2.1% YoY in the previous period.
Support and resistance
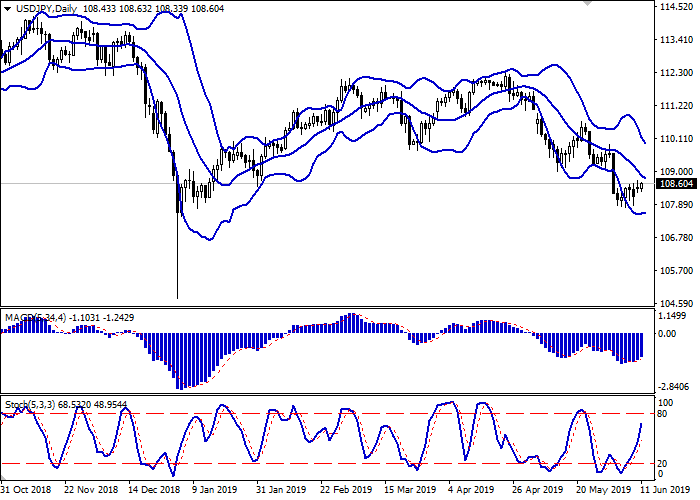
Bollinger Bands in D1 chart demonstrate a gradual decrease. The price range is actively narrowing, reacting to the emergence of a weak uptrend in the short term. MACD indicator is growing, keeping quite stable buy signal (located above the signal line). Stochastic keeps its upward direction but is approaching its maximum levels, which reflects the overbought USD in the ultra-short term.
Existing long positions should be kept in the short term until the situation clears up.
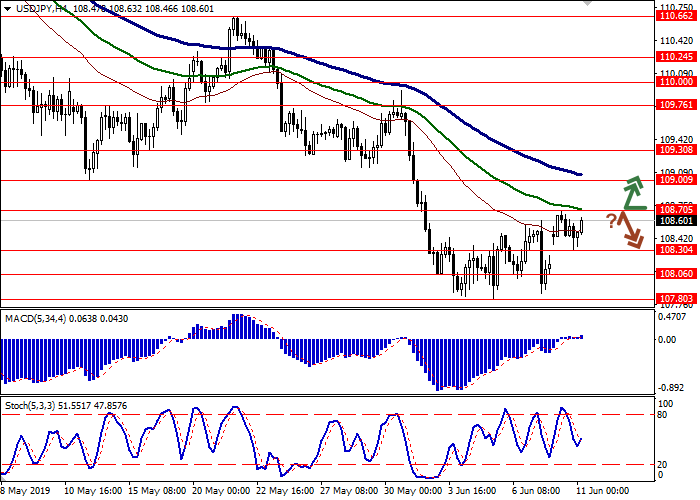
Resistance levels: 108.70, 109.00, 109.30, 109.76.
Support levels: 108.30, 108.06, 107.80.
Trading tips
To open long positions, one can rely on the breakout of 108.70. Take profit — 109.30 or 109.50. Stop loss — 108.40.
The rebound from 108.70 as from resistance with the subsequent breakdown of 108.50–108.40 can become a signal to return to sales with target at 107.80 or 107.70. Stop loss — 108.70–108.80.
Implementation time: 2-3 days.
USD showed ambiguous dynamics against JPY on Monday, ending the day session with almost zero result. USD was supported by optimistic news about the signing of an agreement between the USA and Mexico, which made it possible to avoid imposing import duties on Mexican goods from June 10. Investors also hoped that the US would be able to make some progress in trade negotiations with China.
In turn, the yen received strong support from macroeconomic publications from Japan. Japan's GDP in Q1 2019 showed an increase of 0.6% QoQ after a growth of 0.5% QoQ over the previous period. In annual terms, the growth of the Japanese economy in Q1 2019 reached +2.2% YoY after rising by 2.1% YoY in the previous period.
Support and resistance
Bollinger Bands in D1 chart demonstrate a gradual decrease. The price range is actively narrowing, reacting to the emergence of a weak uptrend in the short term. MACD indicator is growing, keeping quite stable buy signal (located above the signal line). Stochastic keeps its upward direction but is approaching its maximum levels, which reflects the overbought USD in the ultra-short term.
Existing long positions should be kept in the short term until the situation clears up.
Resistance levels: 108.70, 109.00, 109.30, 109.76.
Support levels: 108.30, 108.06, 107.80.
Trading tips
To open long positions, one can rely on the breakout of 108.70. Take profit — 109.30 or 109.50. Stop loss — 108.40.
The rebound from 108.70 as from resistance with the subsequent breakdown of 108.50–108.40 can become a signal to return to sales with target at 107.80 or 107.70. Stop loss — 108.70–108.80.
Implementation time: 2-3 days.


No comments:
Write comments