USD/JPY: ambiguous dynamics
19 June 2019, 09:59
| Scenario | |
|---|---|
| Timeframe | Intraday |
| Recommendation | BUY STOP |
| Entry Point | 108.55, 108.65 |
| Take Profit | 109.30 |
| Stop Loss | 108.30, 108.20 |
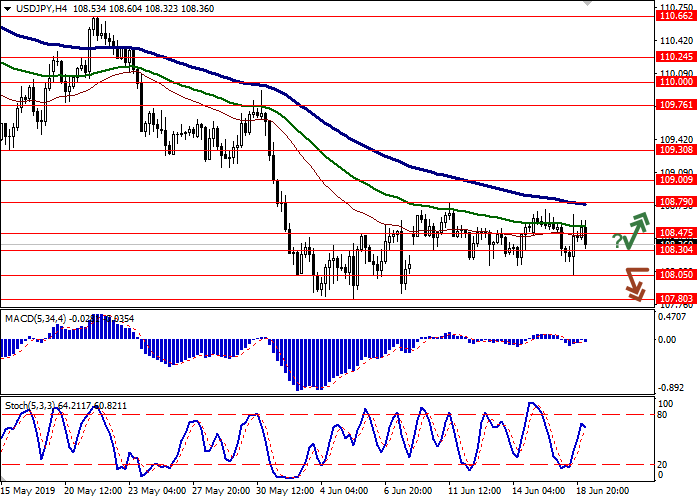
| Key Levels | 107.47, 107.80, 108.05, 108.30, 108.47, 108.79, 109.00, 109.30 |
| Alternative scenario | |
|---|---|
| Recommendation | SELL STOP |
| Entry Point | 108.05, 107.95 |
| Take Profit | 107.60, 107.50 |
| Stop Loss | 108.30, 108.40 |
| Key Levels | 107.47, 107.80, 108.05, 108.30, 108.47, 108.79, 109.00, 109.30 |
Current trend
USD showed a noticeable decline against JPY yesterday but managed to recover. The instrument was supported by optimistic comments from Donald Trump on Twitter announcing a meeting with PRC leader Xi Jinping at the G20 summit. China and the USA should start meeting in the near future to discuss the trade conflict.
Today, the instrument is trading in both directions, and investors expect new drivers and a significant increase in volatility at the end of the week. The Fed meeting will take place on Wednesday, and on Thursday, the BoJ and the BoE will meet, too. Today, the yen is pressured by the statistics from Japan. Exports in May collapsed by 7.8% YoY after falling by 2.4% YoY last month. Imports decreased from 6.5% YoY to -1.5% YoY with a forecast of 0.2% YoY. In May, trade balance was again in deficit of -967.1 billion yen.
Support and resistance
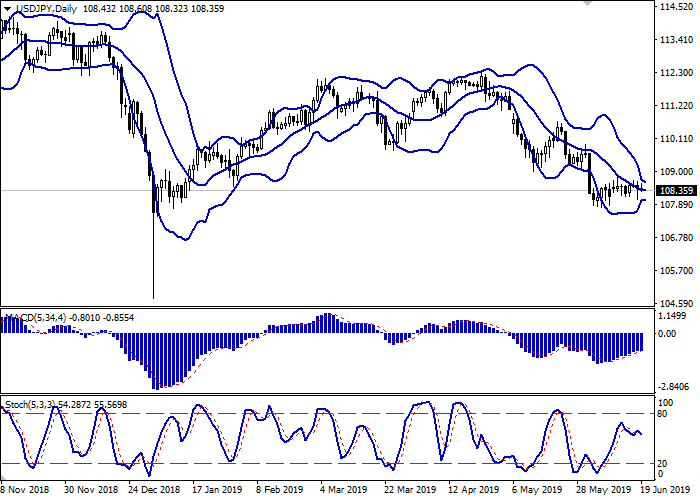
Bollinger Bands on the D1 chart are reversing horizontally. The price range narrows slightly from above, remaining uncomfortable enough for a possible increase in volatility in the second half of the week. MACD indicator is growing preserving a weak buy signal (histogram is above the signal line). Stochastic retains an uncertain downward direction, responding to the predominantly "bearish" start of the week.
To open new transactions, one should wait for additional signals to appear.
Resistance levels: 108.47, 108.79, 109.00, 109.30.
Support levels: 108.30, 108.05, 107.80, 107.47.


Trading tips
Long positions should be opened if the price moves away from support levels followed by the breakout of 108.50–108.60. Take-profit – 109.30. Stop loss – 108.30–108.20.
The development of "bearish" dynamics with the breakdown of 108.10–108.00 may become a signal to start sales with the target at 107.60–107.50. Stop loss – 108.30–108.40.
Implementation period: 2-3 days.
USD showed a noticeable decline against JPY yesterday but managed to recover. The instrument was supported by optimistic comments from Donald Trump on Twitter announcing a meeting with PRC leader Xi Jinping at the G20 summit. China and the USA should start meeting in the near future to discuss the trade conflict.
Today, the instrument is trading in both directions, and investors expect new drivers and a significant increase in volatility at the end of the week. The Fed meeting will take place on Wednesday, and on Thursday, the BoJ and the BoE will meet, too. Today, the yen is pressured by the statistics from Japan. Exports in May collapsed by 7.8% YoY after falling by 2.4% YoY last month. Imports decreased from 6.5% YoY to -1.5% YoY with a forecast of 0.2% YoY. In May, trade balance was again in deficit of -967.1 billion yen.
Support and resistance
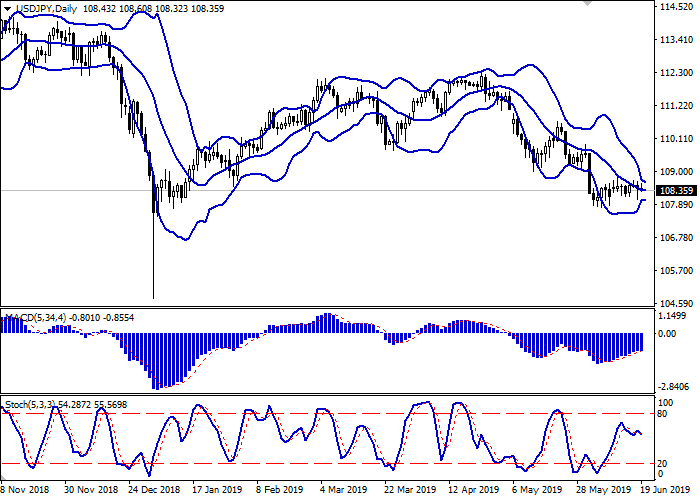
Bollinger Bands on the D1 chart are reversing horizontally. The price range narrows slightly from above, remaining uncomfortable enough for a possible increase in volatility in the second half of the week. MACD indicator is growing preserving a weak buy signal (histogram is above the signal line). Stochastic retains an uncertain downward direction, responding to the predominantly "bearish" start of the week.
To open new transactions, one should wait for additional signals to appear.
Resistance levels: 108.47, 108.79, 109.00, 109.30.
Support levels: 108.30, 108.05, 107.80, 107.47.


Trading tips
Long positions should be opened if the price moves away from support levels followed by the breakout of 108.50–108.60. Take-profit – 109.30. Stop loss – 108.30–108.20.
The development of "bearish" dynamics with the breakdown of 108.10–108.00 may become a signal to start sales with the target at 107.60–107.50. Stop loss – 108.30–108.40.
Implementation period: 2-3 days.


No comments:
Write comments