USD/CAD: the correction
19 June 2019, 09:57
| Scenario | |
|---|---|
| Timeframe | Intraday |
| Recommendation | BUY STOP |
| Entry Point | 1.3405 |
| Take Profit | 1.3479, 1.3500 |
| Stop Loss | 1.3356 |
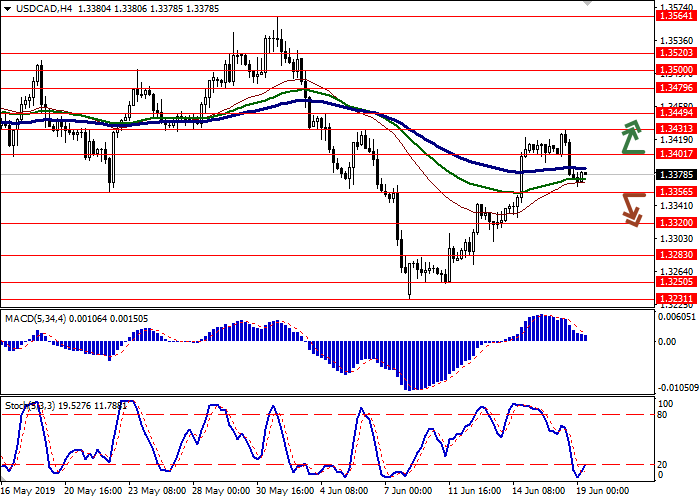
| Key Levels | 1.3250, 1.3283, 1.3320, 1.3356, 1.3401, 1.3431, 1.3449, 1.3479 |
| Alternative scenario | |
|---|---|
| Recommendation | SELL STOP |
| Entry Point | 1.3350 |
| Take Profit | 1.3283, 1.3250 |
| Stop Loss | 1.3400 |
| Key Levels | 1.3250, 1.3283, 1.3320, 1.3356, 1.3401, 1.3431, 1.3449, 1.3479 |
Current trend
Yesterday, USD fell steadily against CAD, interrupting the development of an upward trend in the short term due to the closing of the profitable positions by investors before the publication of the Fed's decision on interest rates. At this meeting, no changes are expected but the Fed may announce new measures of stimulation in July. As always, investors will pay attention to the comments of the official representatives and the updated forecasts of the regulator.
Consumer inflation data will be released in Canada on Wednesday. It is predicted that May’s Price Index may slow down from the previous +0.4% MoM to +0.2% MoM. However, analysts expect growth from +2.0% YoY to +2.2% YoY. The Core Price Index of the Bank of Canada may decline by 0.1% MoM in May after zero dynamics in April. The forecast assumes a slowdown from +1.5% YoY to +1.2% YoY.
Support and resistance
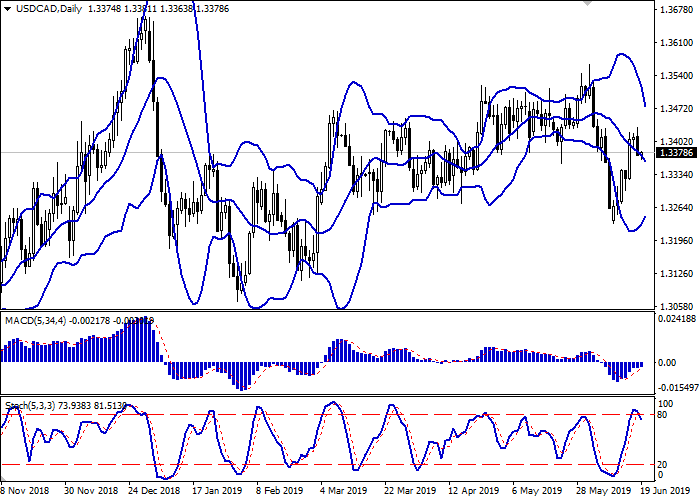
On the daily chart, Bollinger bands steadily decline. The price range actively narrows, reflecting the change in trade direction in the short term. The MACD grows, keeping a poor buy signal (the histogram is above the signal line). Stochastic reverses downwards near its highs, reflecting the possibility of a corrective decline in the short and/or super short term.
It is possible to open new short positions in the nearest future.
Resistance levels: 1.3401, 1.3431, 1.3449, 1.3479.
Support levels: 1.3356, 1.3320, 1.3283, 1.3250.


Trading tips
Long positions can be opened after the breakout of 1.3401 with the target at 1.3479 or 1.3500. Stop loss is 1.3356.
Short positions can be opened after the breakdown of 1.3356 with the target at 1.3283 or 1.3250. Stop loss is 1.3400.
Implementation period: 2–3 days.
Yesterday, USD fell steadily against CAD, interrupting the development of an upward trend in the short term due to the closing of the profitable positions by investors before the publication of the Fed's decision on interest rates. At this meeting, no changes are expected but the Fed may announce new measures of stimulation in July. As always, investors will pay attention to the comments of the official representatives and the updated forecasts of the regulator.
Consumer inflation data will be released in Canada on Wednesday. It is predicted that May’s Price Index may slow down from the previous +0.4% MoM to +0.2% MoM. However, analysts expect growth from +2.0% YoY to +2.2% YoY. The Core Price Index of the Bank of Canada may decline by 0.1% MoM in May after zero dynamics in April. The forecast assumes a slowdown from +1.5% YoY to +1.2% YoY.
Support and resistance
On the daily chart, Bollinger bands steadily decline. The price range actively narrows, reflecting the change in trade direction in the short term. The MACD grows, keeping a poor buy signal (the histogram is above the signal line). Stochastic reverses downwards near its highs, reflecting the possibility of a corrective decline in the short and/or super short term.
It is possible to open new short positions in the nearest future.
Resistance levels: 1.3401, 1.3431, 1.3449, 1.3479.
Support levels: 1.3356, 1.3320, 1.3283, 1.3250.


Trading tips
Long positions can be opened after the breakout of 1.3401 with the target at 1.3479 or 1.3500. Stop loss is 1.3356.
Short positions can be opened after the breakdown of 1.3356 with the target at 1.3283 or 1.3250. Stop loss is 1.3400.
Implementation period: 2–3 days.


No comments:
Write comments