USD/CHF: USD is correcting
26 June 2019, 09:53
| Scenario | |
|---|---|
| Timeframe | Intraday |
| Recommendation | BUY STOP |
| Entry Point | 0.9780, 0.9805 |
| Take Profit | 0.9900, 0.9935 |
| Stop Loss | 0.9740, 0.9720 |
| Key Levels | 0.9639, 0.9692, 0.9740, 0.9775, 0.9800, 0.9853, 0.9900 |
| Alternative scenario | |
|---|---|
| Recommendation | SELL STOP |
| Entry Point | 0.9735 |
| Take Profit | 0.9639, 0.9600 |
| Stop Loss | 0.9800 |
| Key Levels | 0.9639, 0.9692, 0.9740, 0.9775, 0.9800, 0.9853, 0.9900 |
Current trend
The US dollar showed active growth against the Swiss franc on Tuesday, departing from the updated local lows of September 27. The growth was caused by technical factors of profit taking after a confident downward rally since June 19. Uncertain macroeconomic statistics from the USA prevented a more confident strengthening. Sales of new houses in the United States in May decreased significantly (by 7.8% MoM after falling by 3.7% MoM last month). Analysts had expected growth by 1.9% MoM. The Richmond Fed Manufacturing Index decreased from 5 to 3 points, which turned out to be worse than the constant forecast.
Today, the instrument continues the development of correction. Investors are awaiting the publication of statistics on orders for durable goods from the USA. Switzerland is expected to publish an index of economic expectations for June from the ZEW Institute.
Support and resistance
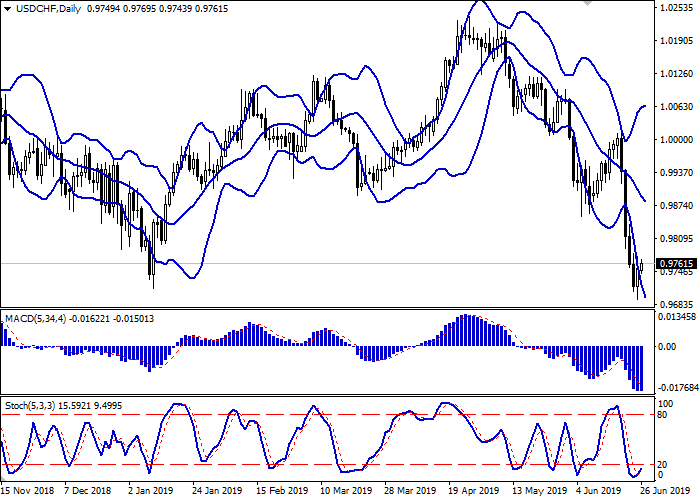
Bollinger Bands in D1 chart demonstrate a stable decrease. The price range is actively expanding from below, reflecting a strong "bearish" impulse formed in the short term. MACD is preparing to reverse upwards preserving a sell signal (histogram being located under the signal line). Stochastic is reversing up, indicating the risks of corrective growth in the ultra-short term.
One should wait for additional signals of the emergence of corrective growth in the short and/or ultra-short term.
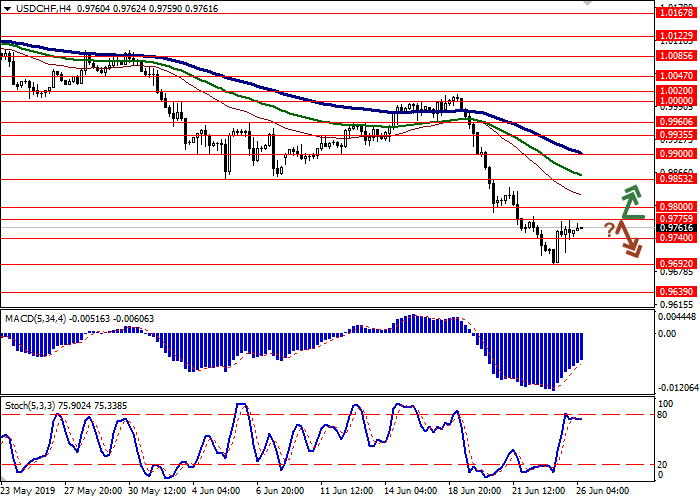
Resistance levels: 0.9775, 0.9800, 0.9853, 0.9900.
Support levels: 0.9740, 0.9692, 0.9639.


Trading tips
To open long positions, one can rely on the breakout of 0.9775 or 0.9800. Take profit — 0.9900 or 0.9935. Stop loss – 0.9740–0.9720.
A rebound from 0.9775, as from resistance, followed by a breakdown of 0.9740, may become a signal for sales with the target at 0.9639–0.9600. Stop loss – 0.9800.
Implementation period: 2-3 days.
The US dollar showed active growth against the Swiss franc on Tuesday, departing from the updated local lows of September 27. The growth was caused by technical factors of profit taking after a confident downward rally since June 19. Uncertain macroeconomic statistics from the USA prevented a more confident strengthening. Sales of new houses in the United States in May decreased significantly (by 7.8% MoM after falling by 3.7% MoM last month). Analysts had expected growth by 1.9% MoM. The Richmond Fed Manufacturing Index decreased from 5 to 3 points, which turned out to be worse than the constant forecast.
Today, the instrument continues the development of correction. Investors are awaiting the publication of statistics on orders for durable goods from the USA. Switzerland is expected to publish an index of economic expectations for June from the ZEW Institute.
Support and resistance
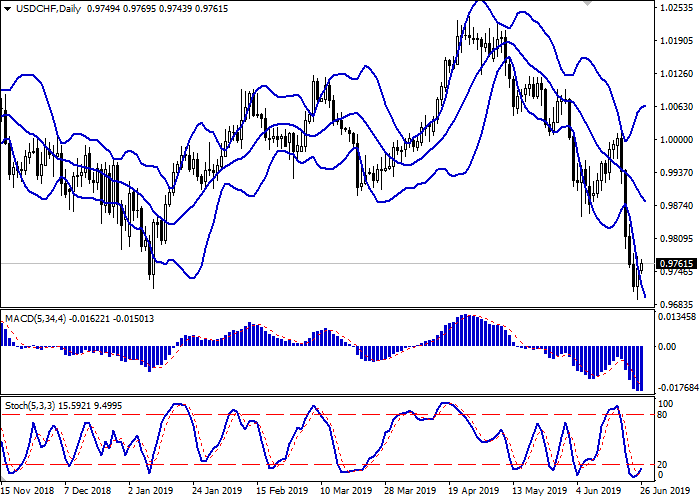
Bollinger Bands in D1 chart demonstrate a stable decrease. The price range is actively expanding from below, reflecting a strong "bearish" impulse formed in the short term. MACD is preparing to reverse upwards preserving a sell signal (histogram being located under the signal line). Stochastic is reversing up, indicating the risks of corrective growth in the ultra-short term.
One should wait for additional signals of the emergence of corrective growth in the short and/or ultra-short term.
Resistance levels: 0.9775, 0.9800, 0.9853, 0.9900.
Support levels: 0.9740, 0.9692, 0.9639.


Trading tips
To open long positions, one can rely on the breakout of 0.9775 or 0.9800. Take profit — 0.9900 or 0.9935. Stop loss – 0.9740–0.9720.
A rebound from 0.9775, as from resistance, followed by a breakdown of 0.9740, may become a signal for sales with the target at 0.9639–0.9600. Stop loss – 0.9800.
Implementation period: 2-3 days.


No comments:
Write comments