USD/CHF: the dollar is growing
17 June 2019, 09:43
| Scenario | |
|---|---|
| Timeframe | Intraday |
| Recommendation | BUY STOP |
| Entry Point | 1.0005 |
| Take Profit | 1.0050, 1.0085 |
| Stop Loss | 0.9970, 0.9960 |
| Key Levels | 0.9878, 0.9900, 0.9935, 0.9960, 1.0000, 1.0020, 1.0047, 1.0085 |
| Alternative scenario | |
|---|---|
| Recommendation | SELL STOP |
| Entry Point | 0.9965, 0.9955 |
| Take Profit | 0.9900, 0.9878 |
| Stop Loss | 1.0000 |
| Key Levels | 0.9878, 0.9900, 0.9935, 0.9960, 1.0000, 1.0020, 1.0047, 1.0085 |
Current trend
On Friday, SD rose steadily against CHF, renewing the highs since June 3. Today, during the Asian session, the instrument continues to strengthen, despite the fact that the fundamental background promises to be neutral.
USD is supported by strong macroeconomic statistics from the USA. Thus, Industrial Production rose by 0.4% MoM in May after a decrease of 0.4% MoM in the previous period. Analysts expected a recovery of positive dynamics but waited for the increase only by 0.2% MoM. The Capacity Utilization rate in May rose from 77.9% to 78.1%, which turned out to be better than the market forecast of 78.0%.
Support and resistance
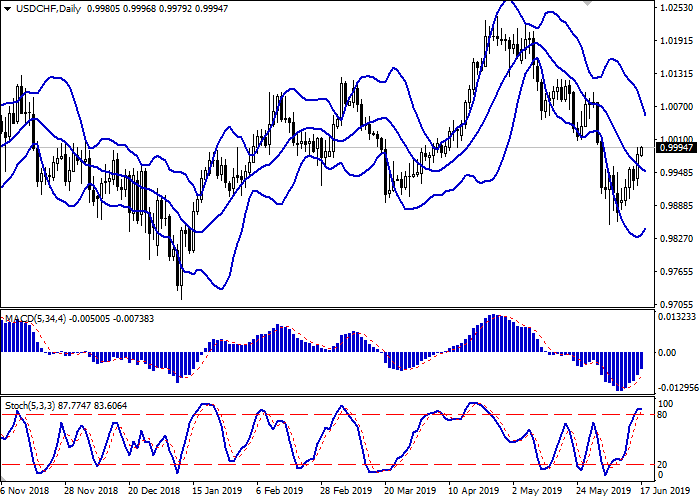
On the daily chart, Bollinger bands are moderately decreasing, tending to reverse into a horizontal plane. The price range is actively narrowing, reflecting a sharp change in the direction of trading in the short/medium term. The MACD indicator is growing, keeping a strong buy signal (the histogram is above the signal line). Stochastic approached its highs and reversed into a horizontal plane, indicating the growing risks of a corrective decline in the super short term.
It is better to keep current long positions until the market situation becomes clearer.
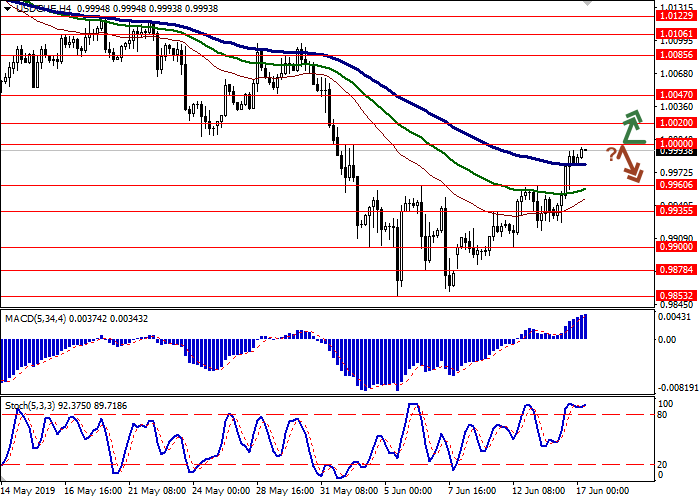
Resistance levels: 1.0000, 1.0020, 1.0047, 1.0085.
Support levels: 0.9960, 0.9935, 0.9900, 0.9878.


Trading tips
Long positions can be opened after the breakout of the level of 1.0000 with the target at 1.0050 or 1.0085. Stop loss is 0.9970–0.9960.
Short positions can be opened after a rebound from the level of 1.0000 and the breakdown of the levels of 0.9970–0.9960 with the target at 0.9900 or 0.9878. Stop loss is no further than 1.0000.
Implementation period: 2–3 days.
On Friday, SD rose steadily against CHF, renewing the highs since June 3. Today, during the Asian session, the instrument continues to strengthen, despite the fact that the fundamental background promises to be neutral.
USD is supported by strong macroeconomic statistics from the USA. Thus, Industrial Production rose by 0.4% MoM in May after a decrease of 0.4% MoM in the previous period. Analysts expected a recovery of positive dynamics but waited for the increase only by 0.2% MoM. The Capacity Utilization rate in May rose from 77.9% to 78.1%, which turned out to be better than the market forecast of 78.0%.
Support and resistance
On the daily chart, Bollinger bands are moderately decreasing, tending to reverse into a horizontal plane. The price range is actively narrowing, reflecting a sharp change in the direction of trading in the short/medium term. The MACD indicator is growing, keeping a strong buy signal (the histogram is above the signal line). Stochastic approached its highs and reversed into a horizontal plane, indicating the growing risks of a corrective decline in the super short term.
It is better to keep current long positions until the market situation becomes clearer.
Resistance levels: 1.0000, 1.0020, 1.0047, 1.0085.
Support levels: 0.9960, 0.9935, 0.9900, 0.9878.


Trading tips
Long positions can be opened after the breakout of the level of 1.0000 with the target at 1.0050 or 1.0085. Stop loss is 0.9970–0.9960.
Short positions can be opened after a rebound from the level of 1.0000 and the breakdown of the levels of 0.9970–0.9960 with the target at 0.9900 or 0.9878. Stop loss is no further than 1.0000.
Implementation period: 2–3 days.


No comments:
Write comments