
USD/CHF: ambiguous dynamics
07 June 2019, 10:17
| Scenario | |
|---|---|
| Timeframe | Intraday |
| Recommendation | BUY STOP |
| Entry Point | 0.9965 |
| Take Profit | 1.0047 |
| Stop Loss | 0.9930, 0.9920 |
| Key Levels | 0.9853, 0.9878, 0.9900, 0.9960, 1.0000, 1.0020, 1.0047 |
| Alternative scenario | |
|---|---|
| Recommendation | SELL STOP |
| Entry Point | 0.9890, 0.9870 |
| Take Profit | 0.9830, 0.9810 |
| Stop Loss | 0.9920, 0.9940 |
| Key Levels | 0.9853, 0.9878, 0.9900, 0.9960, 1.0000, 1.0020, 1.0047 |
Current trend
Yesterday, USD returned to decline against CHF, preventing the development of a corrective upward impulse formed on Wednesday. USD is under pressure of poor US macroeconomic statistics. Thus, Q1 Nonfarm Productivity data reflected a decrease from 3.6% to 3.4% against the forecast of 3.5%. Unit Labor Costs decreased by 1.6% after decreasing by 0.9% in the previous period.
On Friday, investors are focused is the May report on the US labor market. Given the poor statistics on employment from ADP, there are fears that the indicators may be significantly worse than forecasts, which will affect USD negatively. In Switzerland, the May Unemployment Rate and the dynamics of reserves in a foreign currency will be released today.
Support and resistance
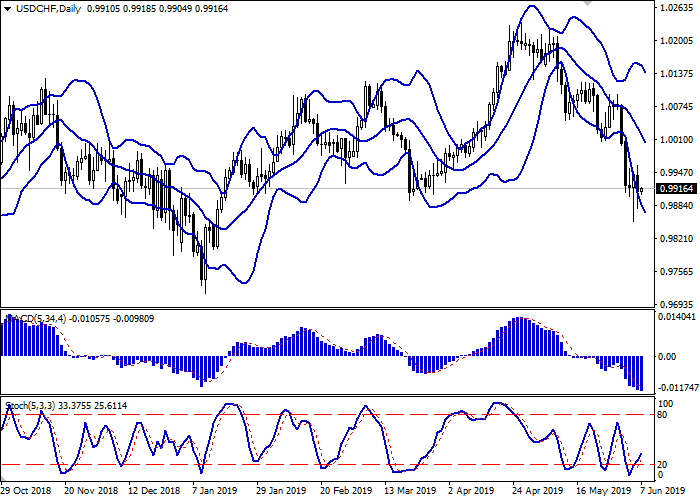
On the daily chart, Bollinger bands fall. The price range expands from below, indicating a strong downward momentum in the short term. The MACD falls, keeping a sell signal (the histogram is below the signal line). Stochastic, responding to the appearance of upward dynamics in the middle of the week, reversed upwards, indicating that USD is oversold in the super short term.
It is better to wait until the situation is clear.
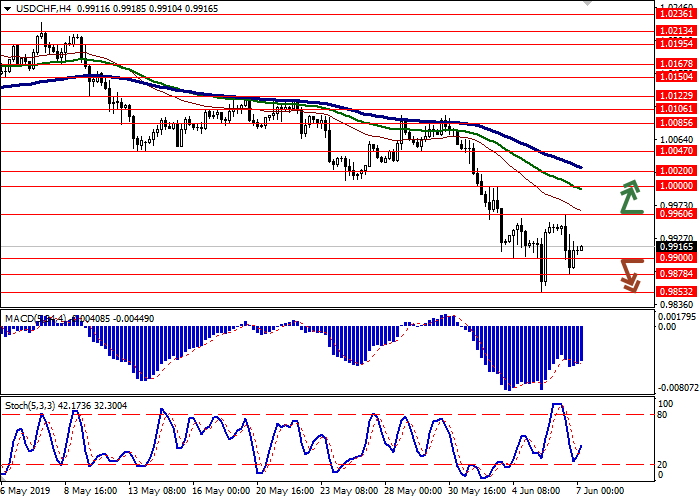
Resistance levels: 0.9960, 1.0000, 1.0020, 1.0047.
Support levels: 0.9900, 0.9878, 0.9853.
Trading tips
Long positions can be opened after the breakout of 0.9960 with the target at 1.0047. Stop loss is 0.9930–0.9920.
Short positions can be opened after the breakdown of 0.9900 or 0.9878 with the target at 0.9830 or 0.9810. Stop loss is 0.9920–0.9940.
Implementation period: 2–3 days.
Yesterday, USD returned to decline against CHF, preventing the development of a corrective upward impulse formed on Wednesday. USD is under pressure of poor US macroeconomic statistics. Thus, Q1 Nonfarm Productivity data reflected a decrease from 3.6% to 3.4% against the forecast of 3.5%. Unit Labor Costs decreased by 1.6% after decreasing by 0.9% in the previous period.
On Friday, investors are focused is the May report on the US labor market. Given the poor statistics on employment from ADP, there are fears that the indicators may be significantly worse than forecasts, which will affect USD negatively. In Switzerland, the May Unemployment Rate and the dynamics of reserves in a foreign currency will be released today.
Support and resistance
On the daily chart, Bollinger bands fall. The price range expands from below, indicating a strong downward momentum in the short term. The MACD falls, keeping a sell signal (the histogram is below the signal line). Stochastic, responding to the appearance of upward dynamics in the middle of the week, reversed upwards, indicating that USD is oversold in the super short term.
It is better to wait until the situation is clear.
Resistance levels: 0.9960, 1.0000, 1.0020, 1.0047.
Support levels: 0.9900, 0.9878, 0.9853.
Trading tips
Long positions can be opened after the breakout of 0.9960 with the target at 1.0047. Stop loss is 0.9930–0.9920.
Short positions can be opened after the breakdown of 0.9900 or 0.9878 with the target at 0.9830 or 0.9810. Stop loss is 0.9920–0.9940.
Implementation period: 2–3 days.


No comments:
Write comments