USD/CAD: the instrument consolidated
14 June 2019, 09:38
| Scenario | |
|---|---|
| Timeframe | Intraday |
| Recommendation | BUY STOP |
| Entry Point | 1.3360 |
| Take Profit | 1.3429, 1.3449 |
| Stop Loss | 1.3320 |
| Key Levels | 1.3231, 1.3250, 1.3283, 1.3320, 1.3356, 1.3379, 1.3401, 1.3429 |
| Alternative scenario | |
|---|---|
| Recommendation | SELL STOP |
| Entry Point | 1.3315 |
| Take Profit | 1.3250, 1.3231 |
| Stop Loss | 1.3356 |
| Key Levels | 1.3231, 1.3250, 1.3283, 1.3320, 1.3356, 1.3379, 1.3401, 1.3429 |
Current trend
Yesterday, USD fell against CAD, interrupting the development of an upward momentum since June 10. The reason for the emergence of negative dynamics was the uncertain macroeconomic statistics from the United States, as well as the closing of profitable long positions by investors at the end of the week. Published on Thursday, data from Canada had virtually no effect on the course. New Housing Price Index of Canada in April did not change in monthly terms and rose by 0.1% YoY, which fully met analysts' forecasts. Today, during the Asian session, the instrument has returned to growth.
On the last day of the week, investors are awaiting the publication of a block of macroeconomic statistics from the United States: Industrial Production, Retail Sales, and Michigan Consumer Sentiment.
Support and resistance
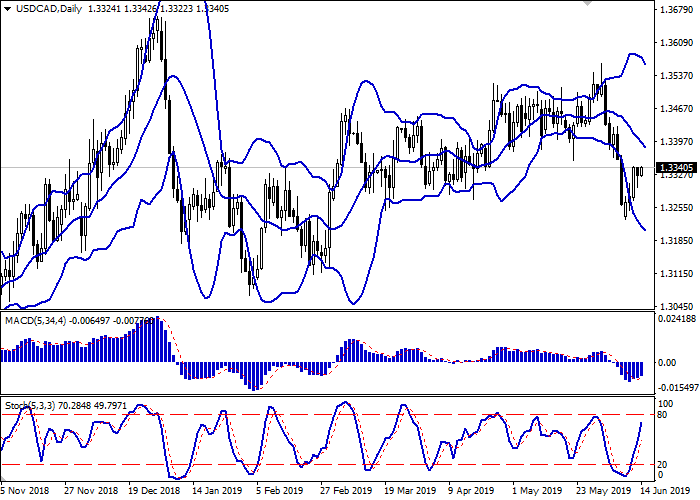
On the daily chart, Bollinger bands are steadily declining. The price range is slightly narrowed but still remains spacious enough for the current activity level. The MACD indicator is growing, keeping a moderate buy signal (the histogram is above the signal line). Stochastic is directed upwards but is nearing its highs, which indicates growing risks that USD will become overbought in the super short term.
It is better to keep current long positions until the market situation becomes clearer.
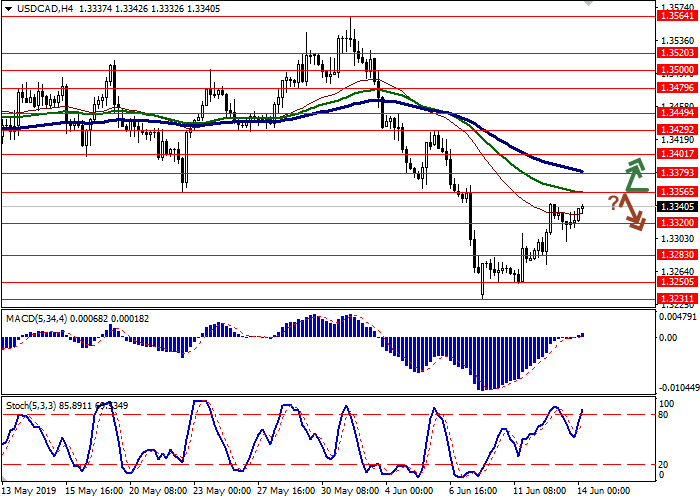
Resistance levels: 1.3356, 1.3379, 1.3401, 1.3429.
Support levels: 1.3320, 1.3283, 1.3250, 1.3231.


Trading tips
Long positions can be opened after the breakout of 1.3356 with the target at 1.3429 or 1.3449. Stop loss is 1.3320.
Short positions can be opened after the rebound from 1.3356 and the breakdown of 1.3320 with the target at 1.3250 or 1.3231. Stop loss is 1.3356.
Implementation period: 2–3 days.
Yesterday, USD fell against CAD, interrupting the development of an upward momentum since June 10. The reason for the emergence of negative dynamics was the uncertain macroeconomic statistics from the United States, as well as the closing of profitable long positions by investors at the end of the week. Published on Thursday, data from Canada had virtually no effect on the course. New Housing Price Index of Canada in April did not change in monthly terms and rose by 0.1% YoY, which fully met analysts' forecasts. Today, during the Asian session, the instrument has returned to growth.
On the last day of the week, investors are awaiting the publication of a block of macroeconomic statistics from the United States: Industrial Production, Retail Sales, and Michigan Consumer Sentiment.
Support and resistance
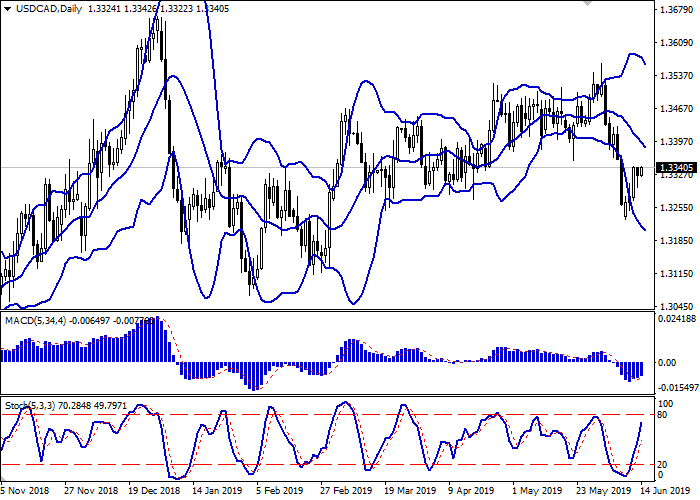
On the daily chart, Bollinger bands are steadily declining. The price range is slightly narrowed but still remains spacious enough for the current activity level. The MACD indicator is growing, keeping a moderate buy signal (the histogram is above the signal line). Stochastic is directed upwards but is nearing its highs, which indicates growing risks that USD will become overbought in the super short term.
It is better to keep current long positions until the market situation becomes clearer.
Resistance levels: 1.3356, 1.3379, 1.3401, 1.3429.
Support levels: 1.3320, 1.3283, 1.3250, 1.3231.


Trading tips
Long positions can be opened after the breakout of 1.3356 with the target at 1.3429 or 1.3449. Stop loss is 1.3320.
Short positions can be opened after the rebound from 1.3356 and the breakdown of 1.3320 with the target at 1.3250 or 1.3231. Stop loss is 1.3356.
Implementation period: 2–3 days.


No comments:
Write comments