
NZD/USD: New Zealand dollar is falling
13 June 2019, 09:33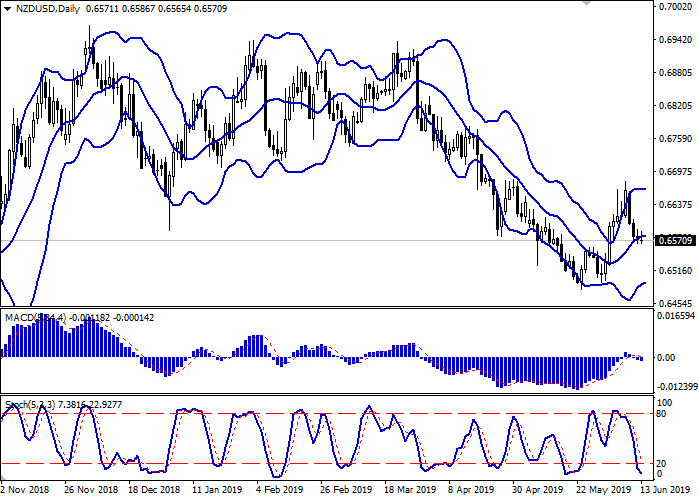
| Scenario | |
|---|---|
| Timeframe | Intraday |
| Recommendation | BUY STOP |
| Entry Point | 0.6595 |
| Take Profit | 0.6645, 0.6665 |
| Stop Loss | 0.6565 |
| Key Levels | 0.6500, 0.6524, 0.6546, 0.6565, 0.6591, 0.6610, 0.6645, 0.6665 |
| Alternative scenario | |
|---|---|
| Recommendation | SELL |
| Entry Point | 0.6560 |
| Take Profit | 0.6500 |
| Stop Loss | 0.6591 |
| Key Levels | 0.6500, 0.6524, 0.6546, 0.6565, 0.6591, 0.6610, 0.6645, 0.6665 |
Current trend
Yesterday, NZD continued to decline against USD, renewing local lows from June 3, due to ambiguous macroeconomic statistics from New Zealand. However, the main factor was USD growth across the entire spectrum of the market. New Zealand Electronic Card Retail Sales declined by 0.5% MoM in May after rising by 0.6% MoM in the previous month. Analysts had expected a growth rate of 0.7% MoM. At the same time, investors were optimistic about the External Migration & Visitors number. In April, the figure rose sharply by 8.3% YoY after a decrease of 2.6% YoY last month. The forecast suggested a much more modest growth of 3.3% YoY. Additional support for the rate was provided by May’s Chinese data on consumer inflation, which accelerated from 2.5% to 2.7%, as expected.
Support and resistance
On the daily chart, Bollinger bands reverse into a horizontal plane. The price range narrows below, reflecting the emergence of ambiguous trading dynamics. The MACD indicator is falling, keeping a moderate sell signal (the histogram is below the signal line), and is trying to consolidate below the zero line. Stochastic is directed downwards but is in close proximity to its lows, indicating that NZD is oversold in the super short term.
It is better to keep current short positions in the short term until the market situation becomes clearer.
Resistance levels: 0.6591, 0.6610, 0.6645, 0.6665.
Support levels: 0.6565, 0.6546, 0.6524, 0.6500.
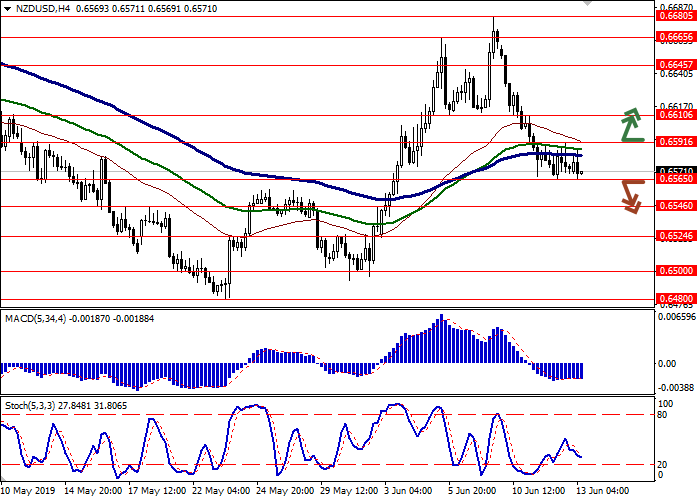

Trading tips
Long positions can be opened after the breakout of 0.6591 with the target at 0.6645 or 0.6665. Stop loss is 0.6565.
Short positions can be opened after the breakdown of 0.6565 with the target at 0.6500. Stop loss is 0.6591.
Implementation period: 2–3 days.
Yesterday, NZD continued to decline against USD, renewing local lows from June 3, due to ambiguous macroeconomic statistics from New Zealand. However, the main factor was USD growth across the entire spectrum of the market. New Zealand Electronic Card Retail Sales declined by 0.5% MoM in May after rising by 0.6% MoM in the previous month. Analysts had expected a growth rate of 0.7% MoM. At the same time, investors were optimistic about the External Migration & Visitors number. In April, the figure rose sharply by 8.3% YoY after a decrease of 2.6% YoY last month. The forecast suggested a much more modest growth of 3.3% YoY. Additional support for the rate was provided by May’s Chinese data on consumer inflation, which accelerated from 2.5% to 2.7%, as expected.
Support and resistance
On the daily chart, Bollinger bands reverse into a horizontal plane. The price range narrows below, reflecting the emergence of ambiguous trading dynamics. The MACD indicator is falling, keeping a moderate sell signal (the histogram is below the signal line), and is trying to consolidate below the zero line. Stochastic is directed downwards but is in close proximity to its lows, indicating that NZD is oversold in the super short term.
It is better to keep current short positions in the short term until the market situation becomes clearer.
Resistance levels: 0.6591, 0.6610, 0.6645, 0.6665.
Support levels: 0.6565, 0.6546, 0.6524, 0.6500.
Trading tips
Long positions can be opened after the breakout of 0.6591 with the target at 0.6645 or 0.6665. Stop loss is 0.6565.
Short positions can be opened after the breakdown of 0.6565 with the target at 0.6500. Stop loss is 0.6591.
Implementation period: 2–3 days.


No comments:
Write comments