GBP/USD: GBP continues to grow
05 June 2019, 10:25
| Scenario | |
|---|---|
| Timeframe | Intraday |
| Recommendation | BUY STOP |
| Entry Point | 1.2755 |
| Take Profit | 1.2864, 1.2902, 1.2915 |
| Stop Loss | 1.2670 |
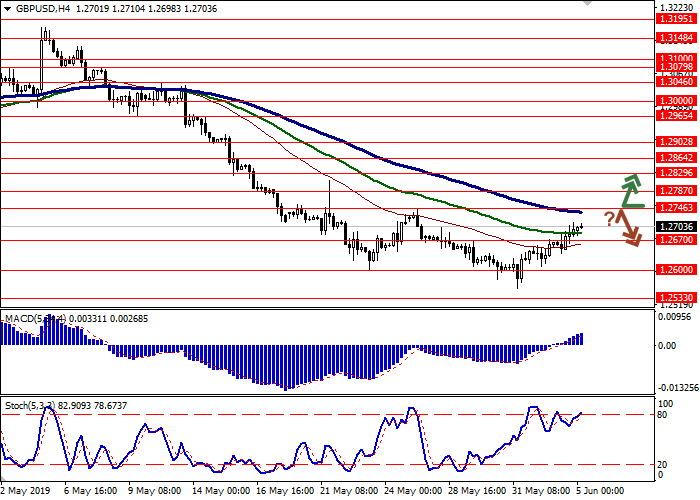
| Key Levels | 1.2533, 1.2600, 1.2670, 1.2746, 1.2787, 1.2829, 1.2864 |
| Alternative scenario | |
|---|---|
| Recommendation | SELL STOP |
| Entry Point | 1.2665 |
| Take Profit | 1.2533 |
| Stop Loss | 1.2730, 1.2740 |
| Key Levels | 1.2533, 1.2600, 1.2670, 1.2746, 1.2787, 1.2829, 1.2864 |
Current trend
GBP maintains an uptrend against USD, noting the new local highs of May 27. Tuesday’s UK macroeconomic statistics was negative, but there was no significant pressure on GBP. The UK Construction PMI fell sharply in May from 50.5 to 48.6 points, while the forecast did not suggest any changes in the indicator. BRC Retail Sales Monitor in May also showed a decline of 3.0% YoY after rising by 3.7% YoY last month. Analysts expected an increase of +0.9% YoY.
GBP is under additional pressure from the deadlock around Brexit. Theresa May did not manage to reach an agreement within the Parliament, which forced her to resign from the post of the Conservative Party leader. Perhaps the new Prime Minister will manage to find other ways for dialogue, but the process may be delayed. Only the selection of a new party leader can take more than a month.
Support and resistance
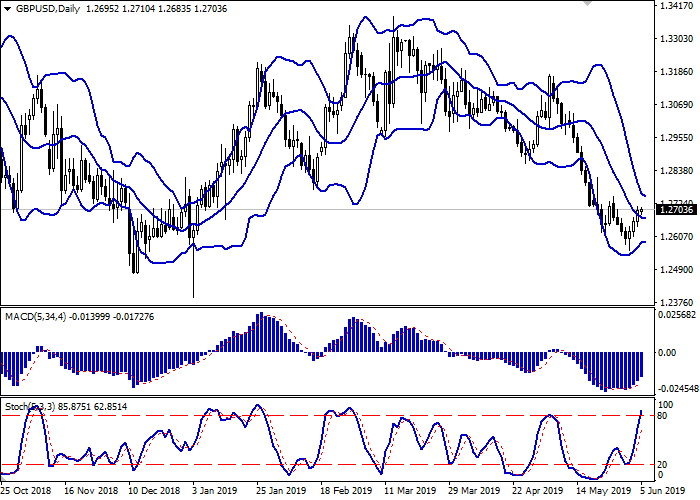
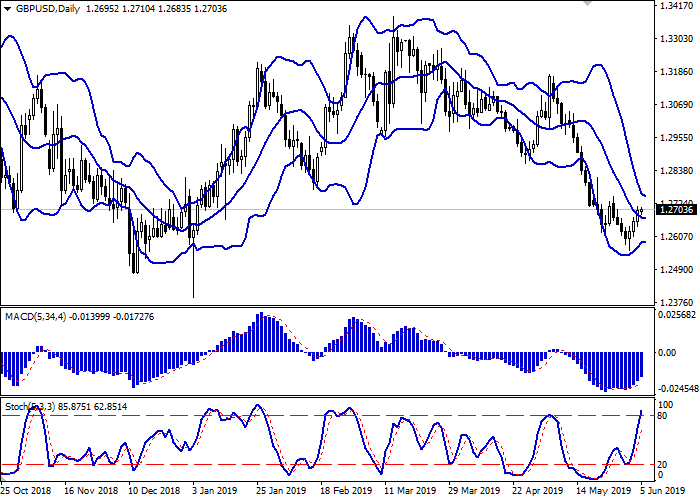
In the D1 chart, Bollinger Bands are reversing horizontally. The price range is narrowing, reflecting a sharp change of trend in the short term. MACD is growing, keeping a stable buy signal (located above the signal line). Stochastic retains an upward direction but is located close to its highs, which indicates the overbought GBP in the ultra-short term.
One should keep the existing long positions in the short and/or ultra-short term until the situation is clear.
Resistance levels: 1.2746, 1.2787, 1.2829, 1.2864.
Support levels: 1.2670, 1.2600, 1.2533.


Trading tips
To open long positions, one can rely on the breakout of 1.2746. Take profit — 1.2864 or 1.2902–1.2915. Stop loss — 1.2670.
The rebound from 1.2746 as from resistance with the subsequent breakdown of 1.2670 can become a signal to return to sales with target at 1.2533. Stop loss — 1.2730–1.2740.
Implementation time: 2-3 days.
GBP maintains an uptrend against USD, noting the new local highs of May 27. Tuesday’s UK macroeconomic statistics was negative, but there was no significant pressure on GBP. The UK Construction PMI fell sharply in May from 50.5 to 48.6 points, while the forecast did not suggest any changes in the indicator. BRC Retail Sales Monitor in May also showed a decline of 3.0% YoY after rising by 3.7% YoY last month. Analysts expected an increase of +0.9% YoY.
GBP is under additional pressure from the deadlock around Brexit. Theresa May did not manage to reach an agreement within the Parliament, which forced her to resign from the post of the Conservative Party leader. Perhaps the new Prime Minister will manage to find other ways for dialogue, but the process may be delayed. Only the selection of a new party leader can take more than a month.
Support and resistance
In the D1 chart, Bollinger Bands are reversing horizontally. The price range is narrowing, reflecting a sharp change of trend in the short term. MACD is growing, keeping a stable buy signal (located above the signal line). Stochastic retains an upward direction but is located close to its highs, which indicates the overbought GBP in the ultra-short term.
One should keep the existing long positions in the short and/or ultra-short term until the situation is clear.
Resistance levels: 1.2746, 1.2787, 1.2829, 1.2864.
Support levels: 1.2670, 1.2600, 1.2533.


Trading tips
To open long positions, one can rely on the breakout of 1.2746. Take profit — 1.2864 or 1.2902–1.2915. Stop loss — 1.2670.
The rebound from 1.2746 as from resistance with the subsequent breakdown of 1.2670 can become a signal to return to sales with target at 1.2533. Stop loss — 1.2730–1.2740.
Implementation time: 2-3 days.


No comments:
Write comments