EUR/USD: EUR is declining
26 June 2019, 09:39
| Scenario | |
|---|---|
| Timeframe | Intraday |
| Recommendation | BUY STOP |
| Entry Point | 1.1375 |
| Take Profit | 1.1447, 1.1460 |
| Stop Loss | 1.1330 |
| Key Levels | 1.1263, 1.1281, 1.1316, 1.1343, 1.1370, 1.1411, 1.1447 |
| Alternative scenario | |
|---|---|
| Recommendation | SELL STOP |
| Entry Point | 1.1340 |
| Take Profit | 1.1263, 1.1246 |
| Stop Loss | 1.1380 |
| Key Levels | 1.1263, 1.1281, 1.1316, 1.1343, 1.1370, 1.1411, 1.1447 |
Current trend
Yesterday, EUR showed a decline against USD, departing from the updated local highs of March 21. The decline was largely technical since the macroeconomic background from the USA remained ambiguous and there was little interesting data from Europe. Sales of new houses in the USA in May decreased significantly (by 7.8% MoM after falling by 3.7% MoM last month). Analysts had expected growth by 1.9% MoM. At the same time, the housing price index in April rose from 0.1% MoM to 0.4% MoM, which turned out to be better than the forecast of 0.2% MoM.
Today, the instrument continues to trade within a downtrend. On Wednesday, investors are focused on the presentation of the ECB representative Yves Mersch, as well as statistics on consumer confidence in Germany. The United States will publish the dynamics of orders for durable goods.
Support and resistance
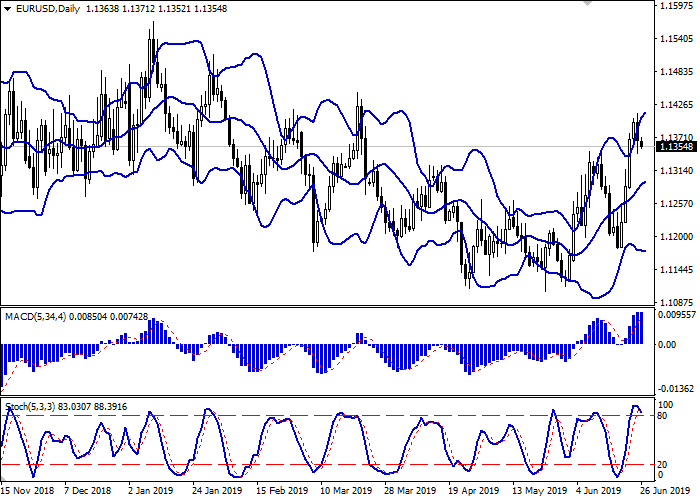
The Bollinger Bands on the D1 chart show active growth. The price range is still expanding from above, freeing a path to new local highs for the "bulls". MACD indicator is gradually reversing down preserving the buy signal (the histogram is located above the signal line). Stochastic shows similar dynamics, preparing to test the level of 80 from abovem.
To open new short positions in the short and/or ultra-short term, one should wait for the confirmation of the "bearish" signals from the indicators.
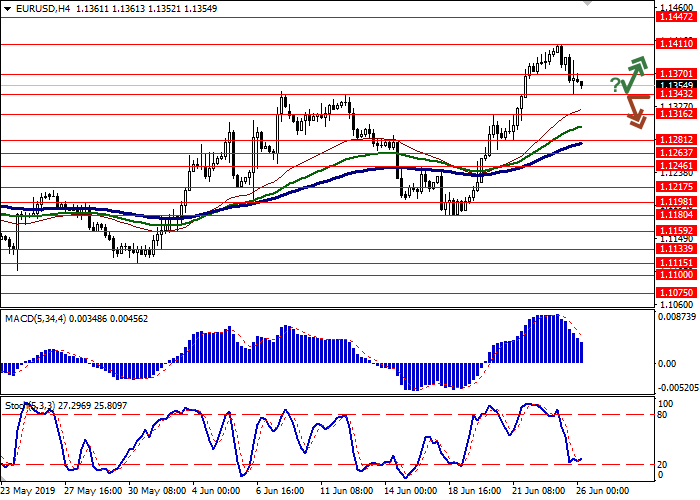
Resistance levels: 1.1370, 1.1411, 1.1447.
Support levels: 1.1343, 1.1316, 1.1281, 1.1263.


Trading tips
Long positions should be opened if the price moves away from 1.1343, as from support, followed by the breakout of 1.1370. Take profit – 1.1447 or 1.1460. Stop loss – 1.1330.
A confident breakdown of 1.1343 may serve as a signal to further sales with the target at 1.1263 or 1.1246. Stop loss – 1.1380.
Implementation period: 2-3 days.
Yesterday, EUR showed a decline against USD, departing from the updated local highs of March 21. The decline was largely technical since the macroeconomic background from the USA remained ambiguous and there was little interesting data from Europe. Sales of new houses in the USA in May decreased significantly (by 7.8% MoM after falling by 3.7% MoM last month). Analysts had expected growth by 1.9% MoM. At the same time, the housing price index in April rose from 0.1% MoM to 0.4% MoM, which turned out to be better than the forecast of 0.2% MoM.
Today, the instrument continues to trade within a downtrend. On Wednesday, investors are focused on the presentation of the ECB representative Yves Mersch, as well as statistics on consumer confidence in Germany. The United States will publish the dynamics of orders for durable goods.
Support and resistance
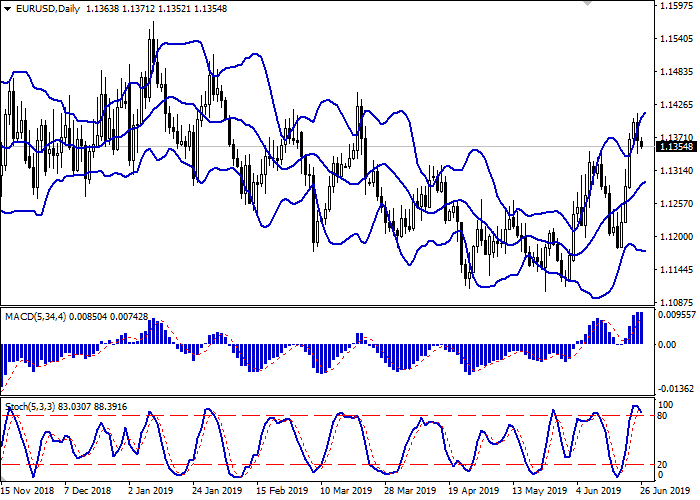
The Bollinger Bands on the D1 chart show active growth. The price range is still expanding from above, freeing a path to new local highs for the "bulls". MACD indicator is gradually reversing down preserving the buy signal (the histogram is located above the signal line). Stochastic shows similar dynamics, preparing to test the level of 80 from abovem.
To open new short positions in the short and/or ultra-short term, one should wait for the confirmation of the "bearish" signals from the indicators.
Resistance levels: 1.1370, 1.1411, 1.1447.
Support levels: 1.1343, 1.1316, 1.1281, 1.1263.


Trading tips
Long positions should be opened if the price moves away from 1.1343, as from support, followed by the breakout of 1.1370. Take profit – 1.1447 or 1.1460. Stop loss – 1.1330.
A confident breakdown of 1.1343 may serve as a signal to further sales with the target at 1.1263 or 1.1246. Stop loss – 1.1380.
Implementation period: 2-3 days.


No comments:
Write comments