AUD/USD: AUD is strengthening
28 June 2019, 09:52
| Scenario | |
|---|---|
| Timeframe | Intraday |
| Recommendation | BUY STOP |
| Entry Point | 0.7025, 0.7035 |
| Take Profit | 0.7051, 0.7080 |
| Stop Loss | 0.7000, 0.7010 |
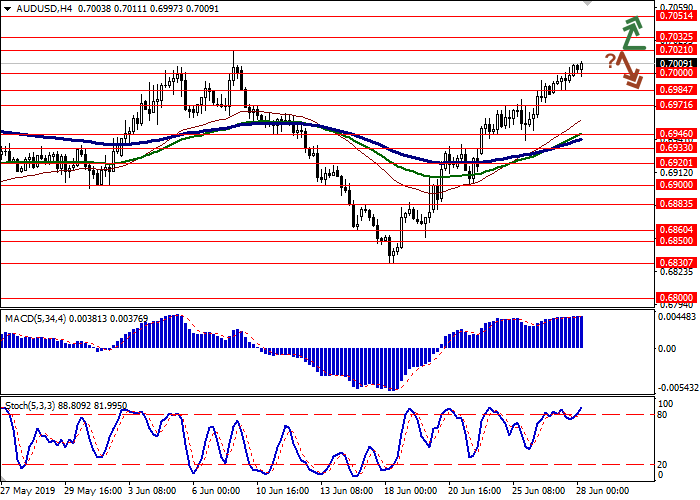
| Key Levels | 0.6946, 0.6971, 0.6984, 0.7000, 0.7021, 0.7032, 0.7051 |
| Alternative scenario | |
|---|---|
| Recommendation | SELL STOP |
| Entry Point | 0.6995 |
| Take Profit | 0.6946, 0.6933 |
| Stop Loss | 0.7030 |
| Key Levels | 0.6946, 0.6971, 0.6984, 0.7000, 0.7021, 0.7032, 0.7051 |
Current trend
AUD continues to grow steadily against USD, updating local highs since June 7. The instrument is supported by optimistic expectations of the results of the meeting between Donald Trump and Xi Jinping at the G20 summit. Earlier, Trump spoke about the possibility of concluding a trade agreement but noted that there are a number of nuances. If the deal fails, Trump promised to introduce 10% import duties on all the remaining Chinese goods. The Chinese side is also positive but intends to make demands, in particular, to restore the possibility of cooperation with Huawei.
Today, the instrument is traded ambiguously. Some pressure on AUD is provided by published data on the dynamics of the private sector lending. In May, the figure rose by 0.2% MoM, slightly worse than market expectations. YoY, the indicator slowed down from 3.7% to 3.6%.
Support and resistance
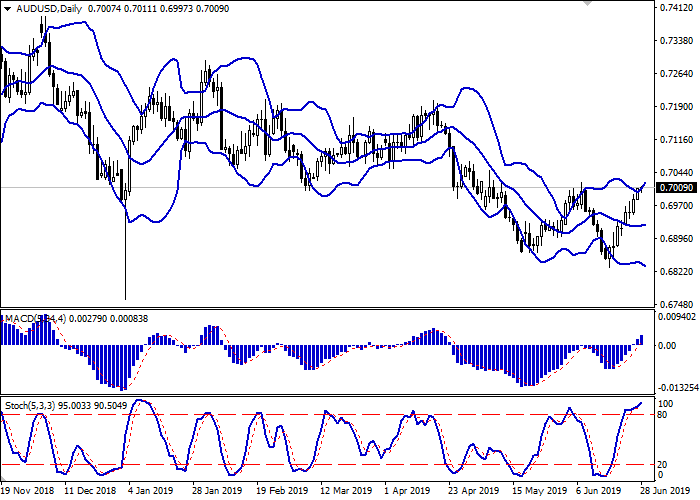
Bollinger Bands in D1 chart show slight growth. The price range is expanding, however, it fails to catch the development of the short-term "bullish" dynamics at the moment. MACD indicator is growing preserving a stable buy signal (the histogram is above the signal line). Stochastic retains an upward direction but is located close to its maximum values, which indicates the risks of the oversold AUD in the ultra-short term.
One should keep existing long positions until clarification.
Resistance levels: 0.7021, 0.7032, 0.7051.
Support levels: 0.7000, 0.6984, 0.6971, 0.6946.


Trading tips
To open long positions, one can rely on the breakout of 0.7021–0.7032. Take profit – 0.7051 or 0.7080. Stop loss – 0.7000–0.7010. Implementation period: 1-2 days.
A rebound from 0.7021, as from resistance, followed by a breakdown of 0.7000, may become a signal for corrective sales with the target at 0.6946–0.6933. Stop loss – 0.7030. Implementation period: 2-3 days.
AUD continues to grow steadily against USD, updating local highs since June 7. The instrument is supported by optimistic expectations of the results of the meeting between Donald Trump and Xi Jinping at the G20 summit. Earlier, Trump spoke about the possibility of concluding a trade agreement but noted that there are a number of nuances. If the deal fails, Trump promised to introduce 10% import duties on all the remaining Chinese goods. The Chinese side is also positive but intends to make demands, in particular, to restore the possibility of cooperation with Huawei.
Today, the instrument is traded ambiguously. Some pressure on AUD is provided by published data on the dynamics of the private sector lending. In May, the figure rose by 0.2% MoM, slightly worse than market expectations. YoY, the indicator slowed down from 3.7% to 3.6%.
Support and resistance
Bollinger Bands in D1 chart show slight growth. The price range is expanding, however, it fails to catch the development of the short-term "bullish" dynamics at the moment. MACD indicator is growing preserving a stable buy signal (the histogram is above the signal line). Stochastic retains an upward direction but is located close to its maximum values, which indicates the risks of the oversold AUD in the ultra-short term.
One should keep existing long positions until clarification.
Resistance levels: 0.7021, 0.7032, 0.7051.
Support levels: 0.7000, 0.6984, 0.6971, 0.6946.


Trading tips
To open long positions, one can rely on the breakout of 0.7021–0.7032. Take profit – 0.7051 or 0.7080. Stop loss – 0.7000–0.7010. Implementation period: 1-2 days.
A rebound from 0.7021, as from resistance, followed by a breakdown of 0.7000, may become a signal for corrective sales with the target at 0.6946–0.6933. Stop loss – 0.7030. Implementation period: 2-3 days.


No comments:
Write comments