
American Express Co.: wave analysis
24 May 2019, 09:22
| Scenario | |
|---|---|
| Timeframe | Weekly |
| Recommendation | BUY |
| Entry Point | 118.48 |
| Take Profit | 125.00, 130.00 |
| Stop Loss | 113.18 |
| Key Levels | 104.50, 108.00, 113.18, 125.00, 130.00 |
| Alternative scenario | |
|---|---|
| Recommendation | SELL STOP |
| Entry Point | 113.10 |
| Take Profit | 108.00, 104.50 |
| Stop Loss | 114.80 |
| Key Levels | 104.50, 108.00, 113.18, 125.00, 130.00 |
The trend is upward.
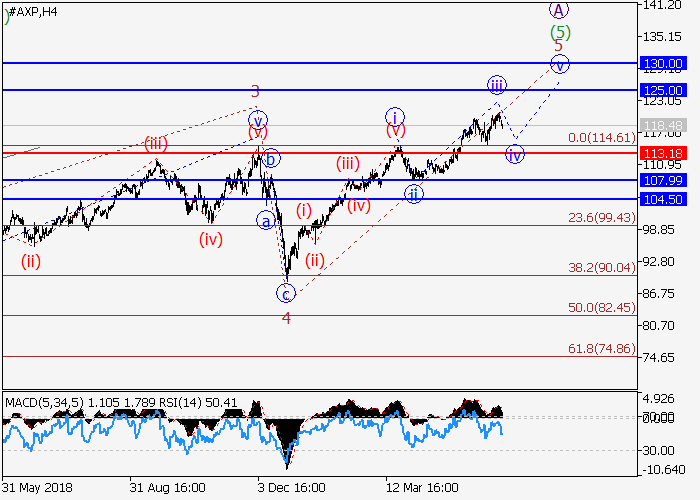
On the 4-hour chart, the correctional wave of the higher level 4 of (5) of A formed, and the wave 5 of (5) develops. Now, the third wave of the lower level iii of 5 has formed, and the local correction iv of 5 is developing. If the assumption is correct, after the end of correction, the price will grow to the levels of 125.00–130.00. In this scenario, critical stop loss level is 113.18.
Main scenario
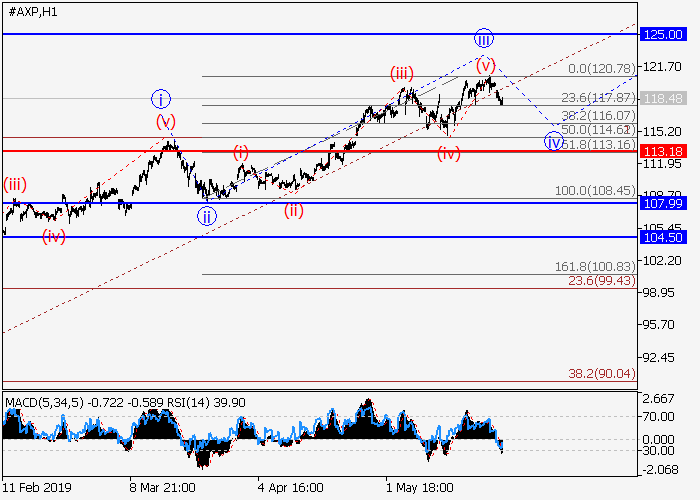
Long positions will become relevant during the correction, above the level of 113.18 with the targets at 125.00–130.00. Implementation period: 7 days and more.
Alternative scenario
The breakout and the consolidation of the price below the level of 113.18 will let the price go down to the levels of 108.00–104.50.
On the 4-hour chart, the correctional wave of the higher level 4 of (5) of A formed, and the wave 5 of (5) develops. Now, the third wave of the lower level iii of 5 has formed, and the local correction iv of 5 is developing. If the assumption is correct, after the end of correction, the price will grow to the levels of 125.00–130.00. In this scenario, critical stop loss level is 113.18.
Main scenario
Long positions will become relevant during the correction, above the level of 113.18 with the targets at 125.00–130.00. Implementation period: 7 days and more.
Alternative scenario
The breakout and the consolidation of the price below the level of 113.18 will let the price go down to the levels of 108.00–104.50.


No comments:
Write comments