XAG/USD: silver prices are consolidating
08 February 2019, 09:06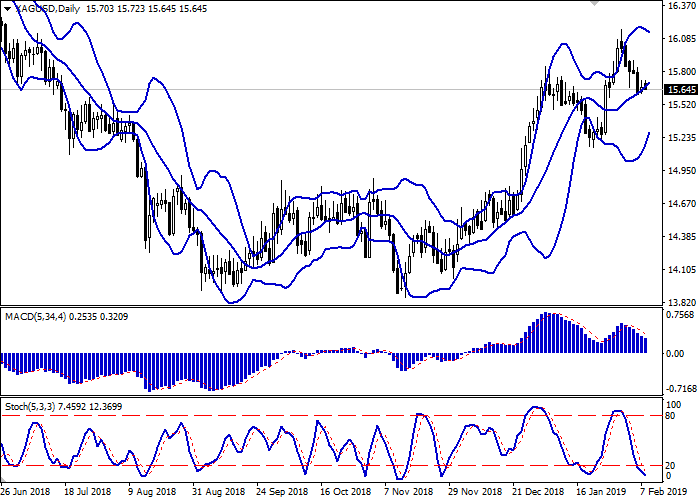
| Scenario | |
|---|---|
| Timeframe | Intraday |
| Recommendation | BUY STOP |
| Entry Point | 15.77 |
| Take Profit | 16.00 |
| Stop Loss | 15.66 |
| Key Levels | 15.40, 15.47, 15.58, 15.66, 15.75, 15.84, 16.00, 16.16 |
| Alternative scenario | |
|---|---|
| Recommendation | SELL STOP |
| Entry Point | 15.55 |
| Take Profit | 15.40, 15.30 |
| Stop Loss | 15.66, 15.70 |
| Key Levels | 15.40, 15.47, 15.58, 15.66, 15.75, 15.84, 16.00, 16.16 |
Current trend
Silver prices showed corrective growth yesterday, departing from local lows of January 28. At the same time, during the Asian session on February 8, the instrument trades down again.
Rising silver prices were due to weak macroeconomic publications from the euro area and the United States, as well as the publication of an updated economic bulletin from the ECB, which pointed to the downside risks to the European economy. German Industrial Production in December showed a decline by 0.4% MoM after a decline by 1.3% MoM, which was sharply worse than expectations of +0.7% MoM. In annual terms, German Industrial Production continues to decline at a record pace (about 4%).
The instrument gained additional support from the news on possible complications of the US-PRC trade negotiations.
Support and resistance
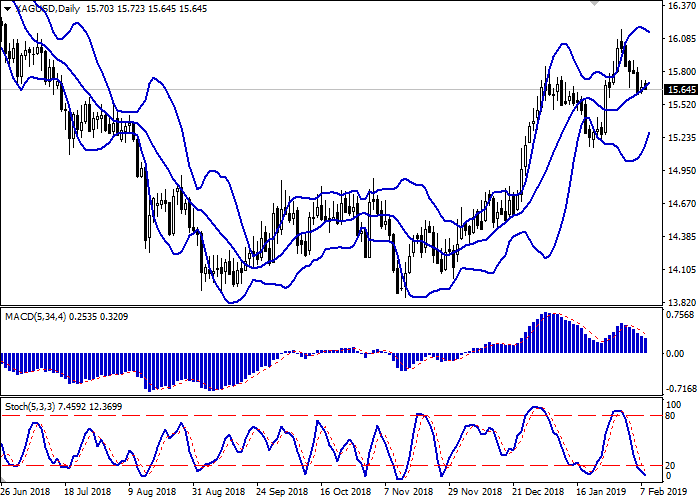
Bollinger Bands in D1 chart show moderate growth. The price range is narrowing, reflecting a sharp change of trend in the short/middle term. MACD is declining keeping a stable sell signal (located below the signal line). Stochastic keeps a confident downward direction but is already approaching its lows, which indicates the descending risks of oversold instrument in the ultra-short term.
Existing short positions should be kept until the situation clears up.
Resistance levels: 15.75, 15.84, 16.00, 16.16.
Support levels: 15.66, 15.58, 15.47, 15.40.
Trading tips
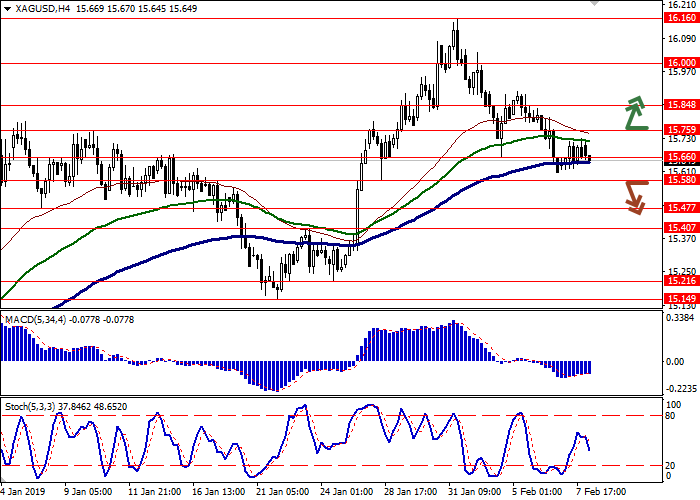
To open long positions, one can rely on the breakout of 15.75. Take profit — 16.00. Stop loss — 15.66.
A confident breakdown of 15.58 may become a signal to further sales with target at 15.40 or 15.30. Stop loss — 15.66 or 15.70.
Implementation period: 2-3 days.
Silver prices showed corrective growth yesterday, departing from local lows of January 28. At the same time, during the Asian session on February 8, the instrument trades down again.
Rising silver prices were due to weak macroeconomic publications from the euro area and the United States, as well as the publication of an updated economic bulletin from the ECB, which pointed to the downside risks to the European economy. German Industrial Production in December showed a decline by 0.4% MoM after a decline by 1.3% MoM, which was sharply worse than expectations of +0.7% MoM. In annual terms, German Industrial Production continues to decline at a record pace (about 4%).
The instrument gained additional support from the news on possible complications of the US-PRC trade negotiations.
Support and resistance
Bollinger Bands in D1 chart show moderate growth. The price range is narrowing, reflecting a sharp change of trend in the short/middle term. MACD is declining keeping a stable sell signal (located below the signal line). Stochastic keeps a confident downward direction but is already approaching its lows, which indicates the descending risks of oversold instrument in the ultra-short term.
Existing short positions should be kept until the situation clears up.
Resistance levels: 15.75, 15.84, 16.00, 16.16.
Support levels: 15.66, 15.58, 15.47, 15.40.
Trading tips
To open long positions, one can rely on the breakout of 15.75. Take profit — 16.00. Stop loss — 15.66.
A confident breakdown of 15.58 may become a signal to further sales with target at 15.40 or 15.30. Stop loss — 15.66 or 15.70.
Implementation period: 2-3 days.



No comments:
Write comments