Brent Crude Oil: general review
08 February 2019, 09:24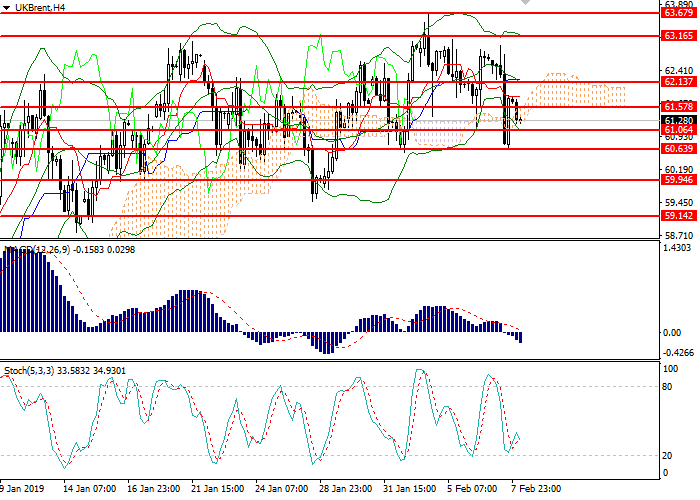
| Scenario | |
|---|---|
| Timeframe | Intraday |
| Recommendation | SELL STOP |
| Entry Point | 59.95 |
| Take Profit | 59.60 |
| Stop Loss | 61.25 |
| Key Levels | 59.14, 59.95, 60.64, 61.06, 61.58, 62.13, 63.16, 63.68 |
| Alternative scenario | |
|---|---|
| Recommendation | BUY STOP |
| Entry Point | 61.70 |
| Take Profit | 62.20 |
| Stop Loss | 61.20 |
| Key Levels | 59.14, 59.95, 60.64, 61.06, 61.58, 62.13, 63.16, 63.68 |
Current trend
On Thursday, the price of Brent crude oil fell after reports that the Russian Federation did not consider it necessary to immediately reduce oil production.
OPEC countries and Saudi Arabia in particular hoped for signing of a formal agreement with Russia on reducing production volumes. However, Moscow currently does not see the need for a forced formalization of the agreement in the OPEC+ format. The Russian side is confident that competitors will take advantage of the decrease in volumes. However, the Minister of Energy of the Russian Federation Alexander Novak announced the possibility of signing the contract at the OPEC meeting in April.
The slowdown in the global economy has a negative impact on oil demand, while the US is close to record production, ahead of Russia and Saudi Arabia.
Today no macroeconomic data releases that may affect the dynamics of the instrument are expected. Traders continue to monitor the attempts of OPEC to influence the Russian Federation. Next Tuesday and Wednesday the US will publish statistics on the level of oil production and the number of drilling rigs.
Support and resistance
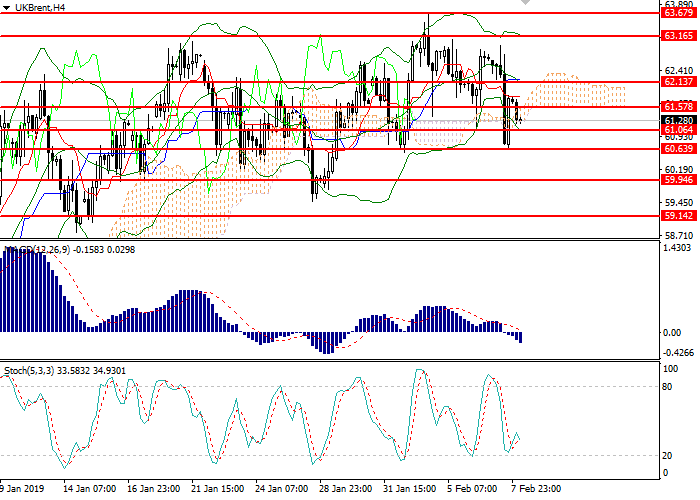
On the H4 chart, the instrument is trading at the lower boundary of Bollinger Bands, which is the key support level. The indicator is reversing downwards, and the price range widened, pointing to the further decline. MACD histogram started declining having formed a sell signal. Stochastic does not give a clear signal for opening positions.
Resistance levels: 61.58, 62.13, 63.16, 63.68.
Support levels: 61.06, 60.64, 59.95, 59.14.
Trading tips
Short positions may be opened below 61.00 with target at 59.60 and stop loss at 61.25. Implementation time: 2-4 days.
Long positions may be opened above 61.65 with target at 62.20 and stop loss at 61.20. Implementation time: 1-3 days.
On Thursday, the price of Brent crude oil fell after reports that the Russian Federation did not consider it necessary to immediately reduce oil production.
OPEC countries and Saudi Arabia in particular hoped for signing of a formal agreement with Russia on reducing production volumes. However, Moscow currently does not see the need for a forced formalization of the agreement in the OPEC+ format. The Russian side is confident that competitors will take advantage of the decrease in volumes. However, the Minister of Energy of the Russian Federation Alexander Novak announced the possibility of signing the contract at the OPEC meeting in April.
The slowdown in the global economy has a negative impact on oil demand, while the US is close to record production, ahead of Russia and Saudi Arabia.
Today no macroeconomic data releases that may affect the dynamics of the instrument are expected. Traders continue to monitor the attempts of OPEC to influence the Russian Federation. Next Tuesday and Wednesday the US will publish statistics on the level of oil production and the number of drilling rigs.
Support and resistance
On the H4 chart, the instrument is trading at the lower boundary of Bollinger Bands, which is the key support level. The indicator is reversing downwards, and the price range widened, pointing to the further decline. MACD histogram started declining having formed a sell signal. Stochastic does not give a clear signal for opening positions.
Resistance levels: 61.58, 62.13, 63.16, 63.68.
Support levels: 61.06, 60.64, 59.95, 59.14.
Trading tips
Short positions may be opened below 61.00 with target at 59.60 and stop loss at 61.25. Implementation time: 2-4 days.
Long positions may be opened above 61.65 with target at 62.20 and stop loss at 61.20. Implementation time: 1-3 days.



No comments:
Write comments