
WTI Crude Oil: general analysis
15 February 2019, 10:15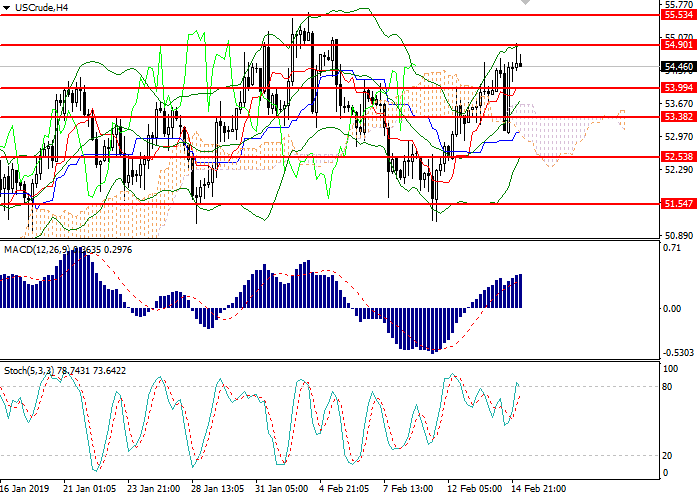
| Scenario | |
|---|---|
| Timeframe | Intraday |
| Recommendation | BUY STOP |
| Entry Point | 54.90 |
| Take Profit | 55.85 |
| Stop Loss | 54.55 |
| Key Levels | 51.54, 52.53, 53.38, 54.00, 54.90, 55.53, 56.35 |
| Alternative scenario | |
|---|---|
| Recommendation | SELL STOP |
| Entry Point | 53.95 |
| Take Profit | 52.05 |
| Stop Loss | 54.45 |
| Key Levels | 51.54, 52.53, 53.38, 54.00, 54.90, 55.53, 56.35 |
Current trend
Oil continues to strengthen due to the growing investors’ interest in high-risk assets.
The catalyst of positive dynamics was the optimism of traders regarding trade negotiations between the United States and China: US President Donald Trump is ready to postpone the introduction of increased trade duties on Chinese goods. At the same time, in January, the volume of oil imports in China grew by 4.8% against the January 2018 value. For the third month in a row, China has been consuming more than 10 million barrels per day, which also provides moderate support to the trading instrument.
Market participants maintain a positive attitude regarding the recovery of prices for "black gold", while the risks generated by the reluctance of Russia to fully implement the agreements within OPEC+ are still relevant.
Today, there is a lack of important macroeconomic publications, so the price movement will be of a technical nature. Also, traders wait for the release of statistics on oil reserves and drilling in the US next week.
Support and resistance
On the 4-hour chart, the instrument is trading at the upper border of Bollinger bands. The indicator is directed upwards, and the price range remains wide, indicating a continuation of the uptrend. MACD histogram keeps the buy signal. Stochastic is preparing to enter the overbought area; a sell signal can be formed during the day.
Resistance levels: 54.90, 55.53, 56.35.
Support levels: 54.00, 53.38, 52.53, 51.54.

Trading tips
Long positions can be opened from the level of 54.90 with the target at 55.85 and stop loss 54.55.
Short positions can be opened below the level of 54.00 with the target at 52.05 and stop loss 54.45.
Implementation period: 2–3 days.
Oil continues to strengthen due to the growing investors’ interest in high-risk assets.
The catalyst of positive dynamics was the optimism of traders regarding trade negotiations between the United States and China: US President Donald Trump is ready to postpone the introduction of increased trade duties on Chinese goods. At the same time, in January, the volume of oil imports in China grew by 4.8% against the January 2018 value. For the third month in a row, China has been consuming more than 10 million barrels per day, which also provides moderate support to the trading instrument.
Market participants maintain a positive attitude regarding the recovery of prices for "black gold", while the risks generated by the reluctance of Russia to fully implement the agreements within OPEC+ are still relevant.
Today, there is a lack of important macroeconomic publications, so the price movement will be of a technical nature. Also, traders wait for the release of statistics on oil reserves and drilling in the US next week.
Support and resistance
On the 4-hour chart, the instrument is trading at the upper border of Bollinger bands. The indicator is directed upwards, and the price range remains wide, indicating a continuation of the uptrend. MACD histogram keeps the buy signal. Stochastic is preparing to enter the overbought area; a sell signal can be formed during the day.
Resistance levels: 54.90, 55.53, 56.35.
Support levels: 54.00, 53.38, 52.53, 51.54.
Trading tips
Long positions can be opened from the level of 54.90 with the target at 55.85 and stop loss 54.55.
Short positions can be opened below the level of 54.00 with the target at 52.05 and stop loss 54.45.
Implementation period: 2–3 days.


No comments:
Write comments