
NZD/USD: general review
15 February 2019, 10:20
| Scenario | |
|---|---|
| Timeframe | Intraday |
| Recommendation | BUY STOP |
| Entry Point | 0.6855 |
| Take Profit | 0.6905 |
| Stop Loss | 0.6825 |
| Key Levels | 0.6706, 0.6720, 0.6742, 0.6773, 0.6808, 0.6855, 0.6871, 0.6906, 0.6941 |
| Alternative scenario | |
|---|---|
| Recommendation | SELL STOP |
| Entry Point | 0.6770 |
| Take Profit | 0.6720 |
| Stop Loss | 0.6810 |
| Key Levels | 0.6706, 0.6720, 0.6742, 0.6773, 0.6808, 0.6855, 0.6871, 0.6906, 0.6941 |
Current trend
On Thursday, the pair showed ambiguous dynamics amid the publication of macroeconomic statistics from the United States.
NZD was supported by a 1.2% decline in retail sales against an expected 0.2% growth. A negative factor was also an increase in the number of Initial Jobless Claims (from February 8) to 239K against a forecast of 225K, and an increase in the number of Secondary Jobless Claims (from February 1) to 1.733 million against a forecast of 1.740 million. USD was supported by Producer Price Index ex Food & Energy, which grew by 2.6% YoY and 0.3% MoM, exceeding the forecast.
Today, investors should focus on the publication of statistics on industrial production in the United States (16:15 GMT+2); moderate volatility is expected in the market.
Support and resistance
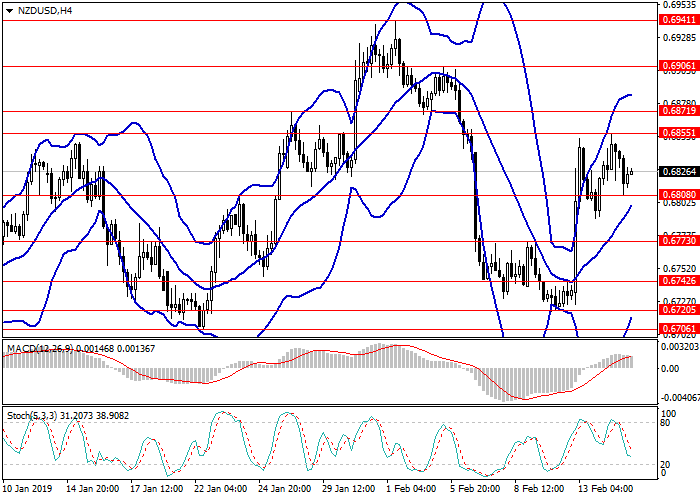
On H4 chart, the instrument is trading between the upper and middle lines of Bollinger Bands. MACD histogram is in the positive area keeping a signal for the opening of long positions.
Support levels: 0.6808, 0.6773, 0.6742, 0.6720, 0.6706.
Resistance levels: 0.6855, 0.6871, 0.6906, 0.6941.
Trading tips
Long positions may be opened from the level of 0.6855 with the target at 0.6905 and stop loss at 0.6825.
Short positions may be opened from the level of 0.6770 with the target at 0.6720 and stop loss at 0.6810.
Implementation period: 1-3 days.
On Thursday, the pair showed ambiguous dynamics amid the publication of macroeconomic statistics from the United States.
NZD was supported by a 1.2% decline in retail sales against an expected 0.2% growth. A negative factor was also an increase in the number of Initial Jobless Claims (from February 8) to 239K against a forecast of 225K, and an increase in the number of Secondary Jobless Claims (from February 1) to 1.733 million against a forecast of 1.740 million. USD was supported by Producer Price Index ex Food & Energy, which grew by 2.6% YoY and 0.3% MoM, exceeding the forecast.
Today, investors should focus on the publication of statistics on industrial production in the United States (16:15 GMT+2); moderate volatility is expected in the market.
Support and resistance
On H4 chart, the instrument is trading between the upper and middle lines of Bollinger Bands. MACD histogram is in the positive area keeping a signal for the opening of long positions.
Support levels: 0.6808, 0.6773, 0.6742, 0.6720, 0.6706.
Resistance levels: 0.6855, 0.6871, 0.6906, 0.6941.
Trading tips
Long positions may be opened from the level of 0.6855 with the target at 0.6905 and stop loss at 0.6825.
Short positions may be opened from the level of 0.6770 with the target at 0.6720 and stop loss at 0.6810.
Implementation period: 1-3 days.


No comments:
Write comments