
USD/JPY: the dollar is trading with a rise
05 February 2019, 09:45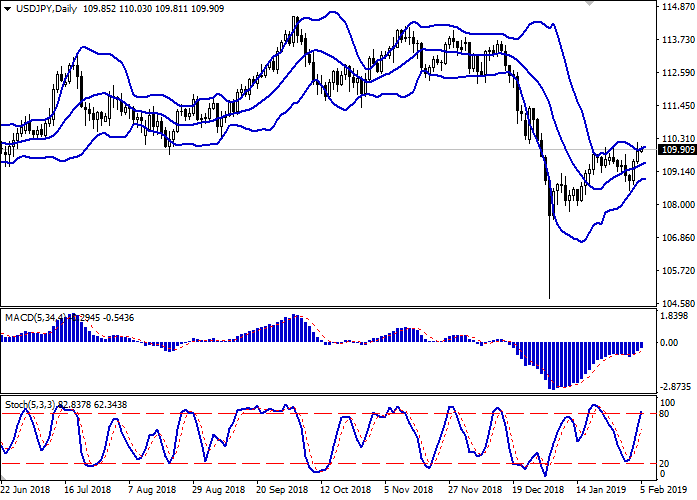
| Scenario | |
|---|---|
| Timeframe | Intraday |
| Recommendation | BUY STOP |
| Entry Point | 110.05, 110.25 |
| Take Profit | 111.00, 111.50 |
| Stop Loss | 109.50, 109.70 |
| Key Levels | 108.00, 108.48, 109.07, 109.45, 110.00, 110.45, 111.00, 111.50 |
| Alternative scenario | |
|---|---|
| Recommendation | SELL STOP |
| Entry Point | 109.40 |
| Take Profit | 108.48, 108.00 |
| Stop Loss | 110.00 |
| Key Levels | 108.00, 108.48, 109.07, 109.45, 110.00, 110.45, 111.00, 111.50 |
Current trend
USD continued to rise against JPY at the beginning of the week, updating local highs of December 31, 2018. The reason for the strengthening of the “bullish” trend in the instrument was the strong data on the US labor market in January, as well as the outlined progress in the US-China trade dispute.
In addition, investors focused on North Korea again, since there were opportunities to conclude a deal on nuclear disarmament of the country.
Today, the dollar is also trading with an increase, but activity in the market remains low due to partially closed exchanges during the Chinese New Year celebration. The Purchasing Managers Index data moderately support JPY. January Markit Service PMI rose from 51.0 to 51.6 points, which was better than the average forecasts.
Support and resistance
Bollinger Bands in D1 chart show moderate growth. The price range is expanding, but it fails to catch the development of "bullish" trend at the moment. MACD indicator is growing, keeping quite stable buy signal (located above the signal line). Stochastic grows more steadily but is rapidly approaching its highs, which reflects risks of the overbought dollar in the ultra-short term.
Existing long positions should be kept until the situation clears up.
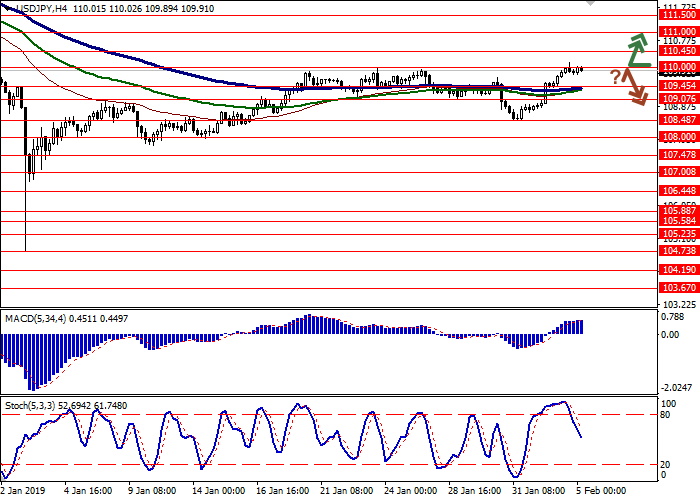
Resistance levels: 110.00, 110.45, 111.00, 111.50.
Support levels: 109.45, 109.07, 108.48, 108.00.

Trading tips
To open long positions one can rely on the breakout of the level of 110.00 or 110.20, in case of maintaining "bullish" signals from technical indicators. Take profit — 111.00 or 111.50. Stop loss — 109.50 or 109.70.
The rebound from the level of 110.00 as from resistance, with the subsequent breakdown of 109.45, can become a signal to begin correctional sales with target at 108.48 or 108.00. Stop loss — 110.00.
Implementation time: 2-3 days.
USD continued to rise against JPY at the beginning of the week, updating local highs of December 31, 2018. The reason for the strengthening of the “bullish” trend in the instrument was the strong data on the US labor market in January, as well as the outlined progress in the US-China trade dispute.
In addition, investors focused on North Korea again, since there were opportunities to conclude a deal on nuclear disarmament of the country.
Today, the dollar is also trading with an increase, but activity in the market remains low due to partially closed exchanges during the Chinese New Year celebration. The Purchasing Managers Index data moderately support JPY. January Markit Service PMI rose from 51.0 to 51.6 points, which was better than the average forecasts.
Support and resistance
Bollinger Bands in D1 chart show moderate growth. The price range is expanding, but it fails to catch the development of "bullish" trend at the moment. MACD indicator is growing, keeping quite stable buy signal (located above the signal line). Stochastic grows more steadily but is rapidly approaching its highs, which reflects risks of the overbought dollar in the ultra-short term.
Existing long positions should be kept until the situation clears up.
Resistance levels: 110.00, 110.45, 111.00, 111.50.
Support levels: 109.45, 109.07, 108.48, 108.00.
Trading tips
To open long positions one can rely on the breakout of the level of 110.00 or 110.20, in case of maintaining "bullish" signals from technical indicators. Take profit — 111.00 or 111.50. Stop loss — 109.50 or 109.70.
The rebound from the level of 110.00 as from resistance, with the subsequent breakdown of 109.45, can become a signal to begin correctional sales with target at 108.48 or 108.00. Stop loss — 110.00.
Implementation time: 2-3 days.


No comments:
Write comments