
USD/CHF: Murrey analysis
14 February 2019, 12:23
| Scenario | |
|---|---|
| Timeframe | Weekly |
| Recommendation | BUY |
| Entry Point | 1.0084 |
| Take Profit | 1.0131, 1.0192 |
| Stop Loss | 1.0040 |
| Key Levels | 0.9887, 0.9948, 1.0000, 1.0070, 1.0131, 1.0192 |
| Alternative scenario | |
|---|---|
| Recommendation | SELL STOP |
| Entry Point | 0.9995 |
| Take Profit | 0.9948, 0.9887 |
| Stop Loss | 1.0050 |
| Key Levels | 0.9887, 0.9948, 1.0000, 1.0070, 1.0131, 1.0192 |
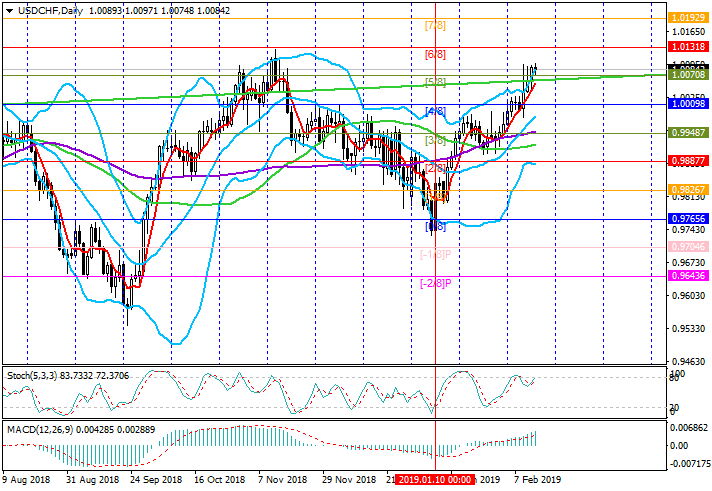
On D1 chart, the price has risen above the level of 1.0070 ([5/8]) and can
continue the growth to 1.0131 ([6/8]) and 1.0192 ([7/8]). This is confirmed by
the upward reversal of the Bollinger Bands and Stochastic; in addition, MACD
histogram is growing in the positive zone. It is also worth noting that an
inverted “Head and shoulders” figure was formed on W1 chart. Currently, the
price breaks the “neck” line upwards, which also indicates the possibility of
growth. A decline will be possible if the instrument consolidates below the
level of 1.0000 ([4/8]) and then moves to the negative zone of the Murrey range.
In this case, the decline will continue to 0.9948 ([3/8]) and 0.9887 ([2/8], the
bottom line of Bollinger Bands).
Support and resistance
Support levels: 1.0070, 1.0000, 0.9948, 0.9887.
Resistance levels: 1.0131, 1.0192.
Trading tips
Long positions may be opened from the current level with targets at 1.0131, 1.0192 and stop loss at 1.0040.
Short positions may be opened if the instrument consolidates below 1.0000 with targets at 0.9948, 0.9887 and stop loss at 1.0050.
Implementation period: 4-5 days.


No comments:
Write comments