
USD/CHF: dollar strengthens
06 February 2019, 08:47
| Scenario | |
|---|---|
| Timeframe | Intraday |
| Recommendation | BUY STOP |
| Entry Point | 1.0025 |
| Take Profit | 1.0050, 1.0073 |
| Stop Loss | 1.0000 |
| Key Levels | 0.9904, 0.9933, 0.9962, 0.9980, 1.0000, 1.0019, 1.0050, 1.0073 |
| Alternative scenario | |
|---|---|
| Recommendation | SELL STOP |
| Entry Point | 0.9975, 0.9955 |
| Take Profit | 0.9904 |
| Stop Loss | 1.0000, 1.0019 |
| Key Levels | 0.9904, 0.9933, 0.9962, 0.9980, 1.0000, 1.0019, 1.0050, 1.0073 |
Current trend
Yesterday, USD rose significantly against CHF, renewing its highs since November 16, 2018. However, closer to the close of the day's session, the currency lost part of the gained positions due to poor US macroeconomic statistics release.
January ISM Service PMI decreased from 58.0 to 56.7 points, while the forecast was 57.2 points. Markit Service PMI fell from 54.4 to 54.2 points, which coincided with market forecasts. January Markit Composite PMI, contrary to expectations, did not rise to 54.5 points but stayed at the level of 54.4 points.
During the Asian session on February 6, the pair is trading in different directions. In addition to the block of macroeconomic statistics from the United States, investors discuss Donald Trump's appeal to the nation, in which the President once again criticized Parliament for its negative attitude to plans to build a wall on the border with Mexico.
Support and resistance
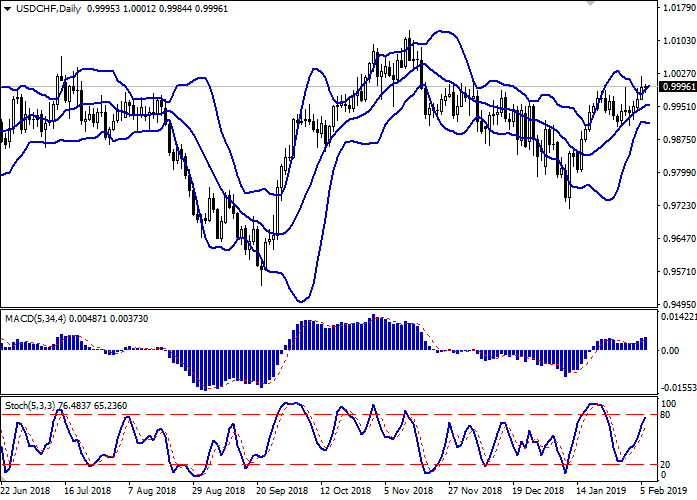
On the daily chart, Bollinger bands grow moderately. The price range widens but not as fast as the "bullish" dynamic develops. MACD rises, keeping a poor buy signal (the histogram is above the signal line). Stochastic grows but is near its highs, which indicates that USD can become overbought in the super short term.
The indicators’ readings do not contradict the further development of the “bullish” trend in the short term.
Resistance levels: 1.0000, 1.0019, 1.0050, 1.0073.
Support levels: 0.9980, 0.9962, 0.9933, 0.9904.
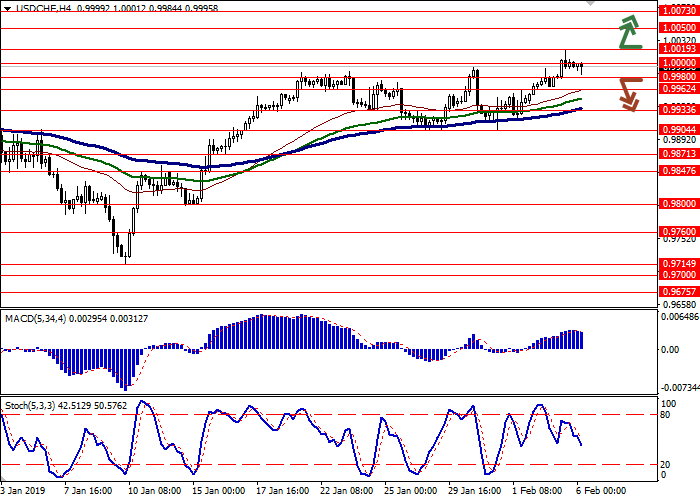
Trading tips
Long positions can be opened after the breakout of 1.0019 with the target at 1.0050 or 1.0073. Stop loss is 1.0000. Implementation period: 1–2 days.
Short positions can be opened after the breakdown of 0.9980–0.9962 with the target at 0.9904. Stop loss is 1.0000–1.0019. Implementation period: 2–3 days.
Yesterday, USD rose significantly against CHF, renewing its highs since November 16, 2018. However, closer to the close of the day's session, the currency lost part of the gained positions due to poor US macroeconomic statistics release.
January ISM Service PMI decreased from 58.0 to 56.7 points, while the forecast was 57.2 points. Markit Service PMI fell from 54.4 to 54.2 points, which coincided with market forecasts. January Markit Composite PMI, contrary to expectations, did not rise to 54.5 points but stayed at the level of 54.4 points.
During the Asian session on February 6, the pair is trading in different directions. In addition to the block of macroeconomic statistics from the United States, investors discuss Donald Trump's appeal to the nation, in which the President once again criticized Parliament for its negative attitude to plans to build a wall on the border with Mexico.
Support and resistance
On the daily chart, Bollinger bands grow moderately. The price range widens but not as fast as the "bullish" dynamic develops. MACD rises, keeping a poor buy signal (the histogram is above the signal line). Stochastic grows but is near its highs, which indicates that USD can become overbought in the super short term.
The indicators’ readings do not contradict the further development of the “bullish” trend in the short term.
Resistance levels: 1.0000, 1.0019, 1.0050, 1.0073.
Support levels: 0.9980, 0.9962, 0.9933, 0.9904.
Trading tips
Long positions can be opened after the breakout of 1.0019 with the target at 1.0050 or 1.0073. Stop loss is 1.0000. Implementation period: 1–2 days.
Short positions can be opened after the breakdown of 0.9980–0.9962 with the target at 0.9904. Stop loss is 1.0000–1.0019. Implementation period: 2–3 days.


No comments:
Write comments