
Brent Crude Oil: oil prices are consolidating
06 February 2019, 08:39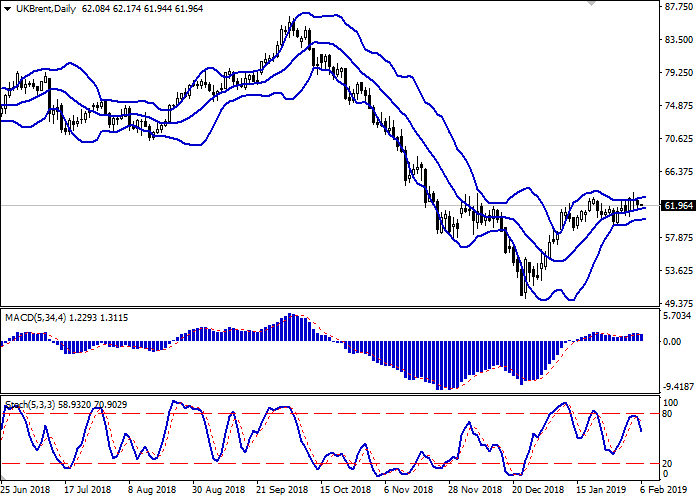
| Scenario | |
|---|---|
| Timeframe | Intraday |
| Recommendation | BUY STOP |
| Entry Point | 62.35 |
| Take Profit | 63.69, 64.42 |
| Stop Loss | 61.50 |
| Key Levels | 59.44, 60.50, 61.00, 61.50, 62.30, 63.08, 63.69, 64.42 |
| Alternative scenario | |
|---|---|
| Recommendation | SELL STOP |
| Entry Point | 61.45, 60.95 |
| Take Profit | 59.44, 58.75 |
| Stop Loss | 62.00, 62.30 |
| Key Levels | 59.44, 60.50, 61.00, 61.50, 62.30, 63.08, 63.69, 64.42 |
Current trend
Prices for Brent crude oil showed a decline on Tuesday, remaining close to the local highs of 2019, updated the day before. Poor data on Factory Orders published on Monday in the United States was the reason for the emergence of negative dynamics.
In turn, the instrument is supported by the tense situation around Venezuela, against which the US may impose sanctions. Additional support comes from OPEC, as the cartel intends to continue to cut oil production in order to stabilize supply and demand in the market.
The report of the American Petroleum Institute reflected a moderate increase in oil reserves, which did not contribute to the development of "bullish" trend of the instrument. Over the week up to February 1, US Crude Oil Stock grew by 2.514M barrels after an increase of 2.098M barrels in the previous period.
Support and resistance
Bollinger Bands in D1 chart show unsteady growth. The price range is almost unchanged, significantly limiting the prospects for further growth of the instrument. MACD reversed downwards having formed a weak sell signal (located below the signal line). Stochastic demonstrates a similar trend, reflecting the weakening risks of an overbought instrument in the ultra-short term.
The development of a full-fledged downtrend is possible in the short and/or ultra-short term.
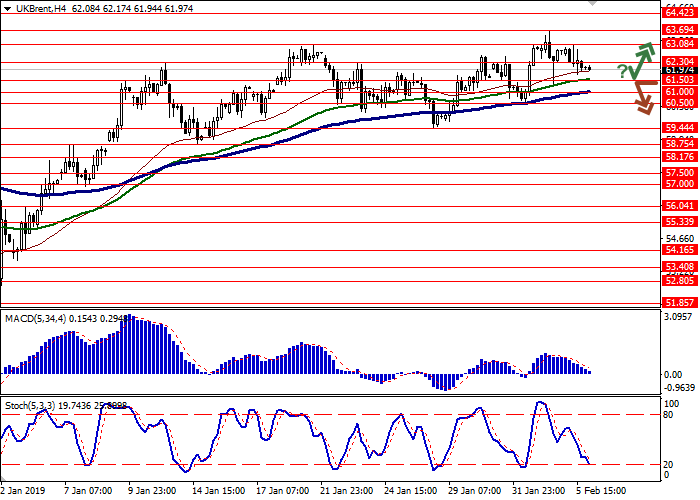
Resistance levels: 62.30, 63.08, 63.69, 64.42.
Support levels: 61.50, 61.00, 60.50, 59.44.

Trading tips
To open long positions, one can rely on the rebound from the support level of 61.50 with the subsequent breakout of 62.30. Take profit — 63.69 or 64.42. Stop loss — 61.50.
A breakdown of 61.50 or 61.00 may be a signal to further sales with target at 59.44 or 58.75. Stop loss — 62.00 or 62.30.
Implementation time: 2-3 days.
Prices for Brent crude oil showed a decline on Tuesday, remaining close to the local highs of 2019, updated the day before. Poor data on Factory Orders published on Monday in the United States was the reason for the emergence of negative dynamics.
In turn, the instrument is supported by the tense situation around Venezuela, against which the US may impose sanctions. Additional support comes from OPEC, as the cartel intends to continue to cut oil production in order to stabilize supply and demand in the market.
The report of the American Petroleum Institute reflected a moderate increase in oil reserves, which did not contribute to the development of "bullish" trend of the instrument. Over the week up to February 1, US Crude Oil Stock grew by 2.514M barrels after an increase of 2.098M barrels in the previous period.
Support and resistance
Bollinger Bands in D1 chart show unsteady growth. The price range is almost unchanged, significantly limiting the prospects for further growth of the instrument. MACD reversed downwards having formed a weak sell signal (located below the signal line). Stochastic demonstrates a similar trend, reflecting the weakening risks of an overbought instrument in the ultra-short term.
The development of a full-fledged downtrend is possible in the short and/or ultra-short term.
Resistance levels: 62.30, 63.08, 63.69, 64.42.
Support levels: 61.50, 61.00, 60.50, 59.44.
Trading tips
To open long positions, one can rely on the rebound from the support level of 61.50 with the subsequent breakout of 62.30. Take profit — 63.69 or 64.42. Stop loss — 61.50.
A breakdown of 61.50 or 61.00 may be a signal to further sales with target at 59.44 or 58.75. Stop loss — 62.00 or 62.30.
Implementation time: 2-3 days.


No comments:
Write comments