
USD/CAD: consolidation and growth is expected
14 February 2019, 14:36
| Scenario | |
|---|---|
| Timeframe | Weekly |
| Recommendation | BUY |
| Entry Point | 1.3262 |
| Take Profit | 1.3530, 1.3665 |
| Stop Loss | 1.3030 |
| Key Levels | 1.2900, 1.2970, 1.3000, 1.3050, 1.3070, 1.3100, 1.3180, 1.3215, 1.3255, 1.3300, 1.3355, 1.3450, 1.3530, 1.3595, 1.3665 |
| Alternative scenario | |
|---|---|
| Recommendation | BUY LIMIT |
| Entry Point | 1.3100 |
| Take Profit | 1.3530, 1.3665 |
| Stop Loss | 1.3030 |
| Key Levels | 1.2900, 1.2970, 1.3000, 1.3050, 1.3070, 1.3100, 1.3180, 1.3215, 1.3255, 1.3300, 1.3355, 1.3450, 1.3530, 1.3595, 1.3665 |
Current trend
In early 2019, USD declined significantly against CAD. However, in early February, it became clear that the pair would not consolidate within the downward trend but would move into a broad sideways one. In the first days of the month, the instrument reached a local minimum at 1.3070 but, having quickly recovered, regained the losses and returned to the levels of 1.3300, 1.3330.
This week, CAD fell due to the release of poor data on the labor market and increased investor demand for USD. But later, USD came under pressure of negative inflation data: the figure stayed at the level of 0.0%, contrary to expectations of a growth of 0.1%.
Today and on Friday, in the United States data on retail sales, industrial production and the labor market will be released, which may affect USD negatively.
Support and resistance
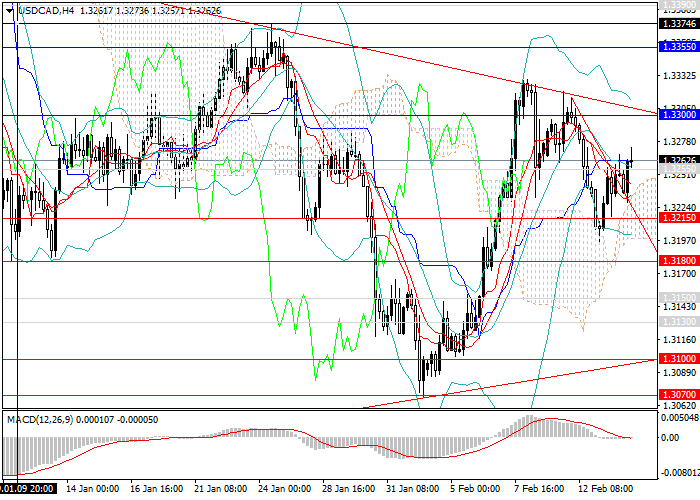
In the short term, the pair is expected to decline to the lower border of the sideways range at 1.3100. In the future, the channel will narrow, and in the long term, the instrument will begin to grow to local highs at the levels of 1.3530, 1.3595, 1.3665.
On the weekly chart, technical indicators confirm the long-term growth forecast: the MACD keeps a high volume of long positions. Bollinger bands are directed horizontally, indicating a transition to consolidation.
Resistance levels: 1.3255, 1.3300, 1.3355, 1.3450, 1.3530, 1.3595, 1.3665.
Support levels: 1.3215, 1.3180, 1.3100, 1.3070, 1.3050, 1.3000, 1.2970, 1.2900.
Trading tips
It is better to increase the volumes of long positions according to the trend from the current level and open pending long positions from the level of 1.3100 with the targets at 1.3530, 1.3665 and stop loss 1.3030.
In early 2019, USD declined significantly against CAD. However, in early February, it became clear that the pair would not consolidate within the downward trend but would move into a broad sideways one. In the first days of the month, the instrument reached a local minimum at 1.3070 but, having quickly recovered, regained the losses and returned to the levels of 1.3300, 1.3330.
This week, CAD fell due to the release of poor data on the labor market and increased investor demand for USD. But later, USD came under pressure of negative inflation data: the figure stayed at the level of 0.0%, contrary to expectations of a growth of 0.1%.
Today and on Friday, in the United States data on retail sales, industrial production and the labor market will be released, which may affect USD negatively.
Support and resistance
In the short term, the pair is expected to decline to the lower border of the sideways range at 1.3100. In the future, the channel will narrow, and in the long term, the instrument will begin to grow to local highs at the levels of 1.3530, 1.3595, 1.3665.
On the weekly chart, technical indicators confirm the long-term growth forecast: the MACD keeps a high volume of long positions. Bollinger bands are directed horizontally, indicating a transition to consolidation.
Resistance levels: 1.3255, 1.3300, 1.3355, 1.3450, 1.3530, 1.3595, 1.3665.
Support levels: 1.3215, 1.3180, 1.3100, 1.3070, 1.3050, 1.3000, 1.2970, 1.2900.
Trading tips
It is better to increase the volumes of long positions according to the trend from the current level and open pending long positions from the level of 1.3100 with the targets at 1.3530, 1.3665 and stop loss 1.3030.


No comments:
Write comments