
Brent Crude Oil: general review
14 February 2019, 14:37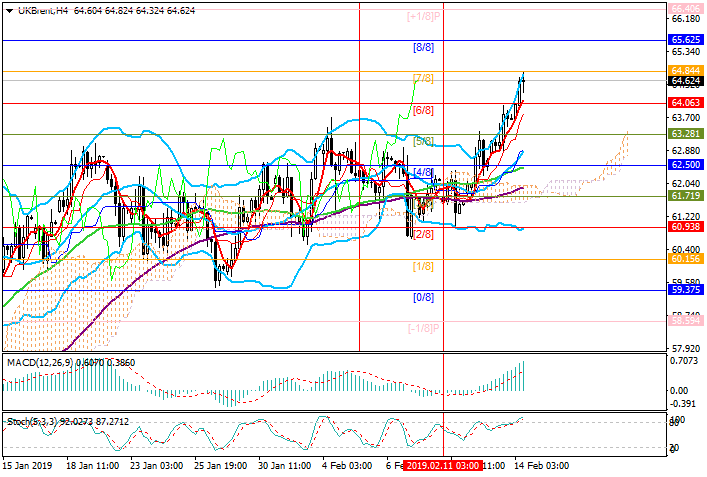
| Scenario | |
|---|---|
| Timeframe | Weekly |
| Recommendation | BUY STOP |
| Entry Point | 65.00 |
| Take Profit | 65.62, 66.40 |
| Stop Loss | 64.60 |
| Key Levels | 62.50, 63.28, 64.06, 65.62, 66.40 |
| Alternative scenario | |
|---|---|
| Recommendation | SELL STOP |
| Entry Point | 64.00 |
| Take Profit | 63.28, 62.50 |
| Stop Loss | 64.50 |
| Key Levels | 62.50, 63.28, 64.06, 65.62, 66.40 |
Current trend
This week, oil quotes added about 4.8% and climbed to the level of 64.84.
Published yesterday, the weekly EIA report on oil reserves in the US recorded their growth by 3.633 million barrels, which is much more than the market expected. Gasoline stocks increased by 0.408 million, and stocks of distillates - by 1.187 million barrels. Oil production remained the same, at 11.9 million barrels per day. The market has hardly responded to these negative data since political factors are supporting oil. China and the United States may be close to concluding a trade agreement, as evidenced by the intention of the PRC Chairman Xi Jinping to meet in person with the leaders of the American trade delegation, Steven Mnuchin and Robert Lighthizer. In addition, due to US sanctions against Iran and Venezuela, there is a shortage of sour crude oil on the market, which also pushes up prices. Meanwhile, OPEC reported a decrease in oil production in January by almost 800K barrels per day to 30.81 million barrels.
Support and resistance
The price is testing 64.84 (Murrey [7/8]) and after its breakdown, it can grow to 65.62 (Murrey [8/8]) and 66.40 (Murrey [+1/8]). If the price consolidates below 64.06 (Murrey [6/8]), the decline may continue to 63.28 (Murrey [3/8]) and 62.50 (Murrey [4/8]).
Generally, technical indicators show continued growth: Bollinger Bands are directed upwards, MACD histogram grows in the positive zone, and Stochastic has entered the overbought zone but is still directed up.
Support levels: 64.06, 63.28, 62.50.
Resistance levels: 65.62, 66.40.

Trading tips
Long positions may be opened from 65.00 with targets at 65.62, 66.40 and stop loss at 64.60.
Short positions may be opened below 64.06 with targets at 63.28, 62.50 and stop loss at 64.50.
Implementation period: 4-5 days.
This week, oil quotes added about 4.8% and climbed to the level of 64.84.
Published yesterday, the weekly EIA report on oil reserves in the US recorded their growth by 3.633 million barrels, which is much more than the market expected. Gasoline stocks increased by 0.408 million, and stocks of distillates - by 1.187 million barrels. Oil production remained the same, at 11.9 million barrels per day. The market has hardly responded to these negative data since political factors are supporting oil. China and the United States may be close to concluding a trade agreement, as evidenced by the intention of the PRC Chairman Xi Jinping to meet in person with the leaders of the American trade delegation, Steven Mnuchin and Robert Lighthizer. In addition, due to US sanctions against Iran and Venezuela, there is a shortage of sour crude oil on the market, which also pushes up prices. Meanwhile, OPEC reported a decrease in oil production in January by almost 800K barrels per day to 30.81 million barrels.
Support and resistance
The price is testing 64.84 (Murrey [7/8]) and after its breakdown, it can grow to 65.62 (Murrey [8/8]) and 66.40 (Murrey [+1/8]). If the price consolidates below 64.06 (Murrey [6/8]), the decline may continue to 63.28 (Murrey [3/8]) and 62.50 (Murrey [4/8]).
Generally, technical indicators show continued growth: Bollinger Bands are directed upwards, MACD histogram grows in the positive zone, and Stochastic has entered the overbought zone but is still directed up.
Support levels: 64.06, 63.28, 62.50.
Resistance levels: 65.62, 66.40.
Trading tips
Long positions may be opened from 65.00 with targets at 65.62, 66.40 and stop loss at 64.60.
Short positions may be opened below 64.06 with targets at 63.28, 62.50 and stop loss at 64.50.
Implementation period: 4-5 days.


No comments:
Write comments