
Brent Crude Oil: oil prices are growing
18 February 2019, 08:57
| Scenario | |
|---|---|
| Timeframe | Intraday |
| Recommendation | BUY STOP |
| Entry Point | 67.05 |
| Take Profit | 67.85, 68.20 |
| Stop Loss | 66.20 |
| Key Levels | 64.42, 65.00, 65.50, 66.06, 67.00, 67.47, 67.85, 68.20 |
| Alternative scenario | |
|---|---|
| Recommendation | SELL STOP |
| Entry Point | 66.00, 65.75 |
| Take Profit | 64.42, 64.00 |
| Stop Loss | 66.80, 66.60 |
| Key Levels | 64.42, 65.00, 65.50, 66.06, 67.00, 67.47, 67.85, 68.20 |
Current trend
Oil prices continue to grow moderately, updating local highs since the end of November.
Quotes are supported by decisive actions of OPEC countries aimed at further reducing production. Last week, Saudi Arabia announced a reduction in March by 0.5 million barrels per day, in addition to what the agreement originally required. The instrument is supported by new US sanctions against Venezuela, as well as increased tensions in the Libyan fields.
In turn, the Baker Hughes report on active drilling rigs in the United States published on February 15 put some pressure on prices. Over the past week, the number of drilling rigs in the country increased from 854 to 857 units.
Support and resistance
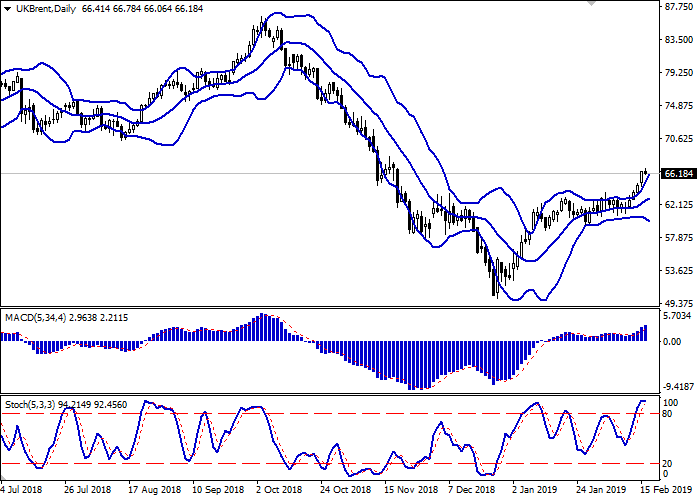
The Bollinger Bands in D1 chart show moderate growth. The price range is expanding, however, failing to follow the “bullish” trend, which indicates risks of the overbought instrument in the short term. MACD indicator is growing preserving a stable buy signal (the histogram is above the signal line). Stochastic, having reached its maxima, reversed horizontally, indicating a strong overbought instrument in the ultra-short term.
One should keep long positions in the short and/or ultra-short term until the signals for a downward correction appear. Currently, one should not open the new "bullish" positions.
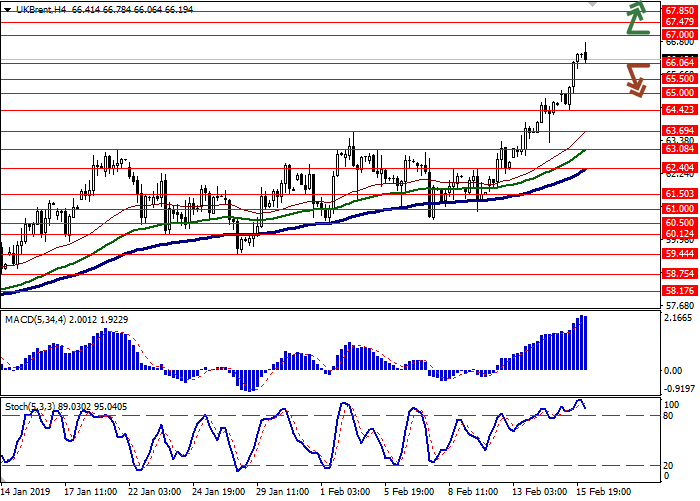
Resistance levels: 67.00, 67.47, 67.85, 68.20.
Support levels: 66.06, 65.50, 65.00, 64.42.
Trading tips
To open long positions, one can rely on the breakout of 67.00. Take profit — 67.85 or 68.20. Stop loss – 66.20. Implementation period: 1-2 days.
The return of "bearish" dynamics with the breakdown of 66.06 or 65.80 may become a signal for correctional sales with the target at 64.42 or 64.00. Stop loss – 66.80-66.60. Implementation period: 2-3 days.
Oil prices continue to grow moderately, updating local highs since the end of November.
Quotes are supported by decisive actions of OPEC countries aimed at further reducing production. Last week, Saudi Arabia announced a reduction in March by 0.5 million barrels per day, in addition to what the agreement originally required. The instrument is supported by new US sanctions against Venezuela, as well as increased tensions in the Libyan fields.
In turn, the Baker Hughes report on active drilling rigs in the United States published on February 15 put some pressure on prices. Over the past week, the number of drilling rigs in the country increased from 854 to 857 units.
Support and resistance
The Bollinger Bands in D1 chart show moderate growth. The price range is expanding, however, failing to follow the “bullish” trend, which indicates risks of the overbought instrument in the short term. MACD indicator is growing preserving a stable buy signal (the histogram is above the signal line). Stochastic, having reached its maxima, reversed horizontally, indicating a strong overbought instrument in the ultra-short term.
One should keep long positions in the short and/or ultra-short term until the signals for a downward correction appear. Currently, one should not open the new "bullish" positions.
Resistance levels: 67.00, 67.47, 67.85, 68.20.
Support levels: 66.06, 65.50, 65.00, 64.42.
Trading tips
To open long positions, one can rely on the breakout of 67.00. Take profit — 67.85 or 68.20. Stop loss – 66.20. Implementation period: 1-2 days.
The return of "bearish" dynamics with the breakdown of 66.06 or 65.80 may become a signal for correctional sales with the target at 64.42 or 64.00. Stop loss – 66.80-66.60. Implementation period: 2-3 days.


No comments:
Write comments