WTI Crude Oil: oil prices rise slightly
18 January 2019, 09:01
| Scenario | |
|---|---|
| Timeframe | Intraday |
| Recommendation | BUY STOP |
| Entry Point | 53.25 |
| Take Profit | 55.64, 56.00 |
| Stop Loss | 52.21, 52.00 |
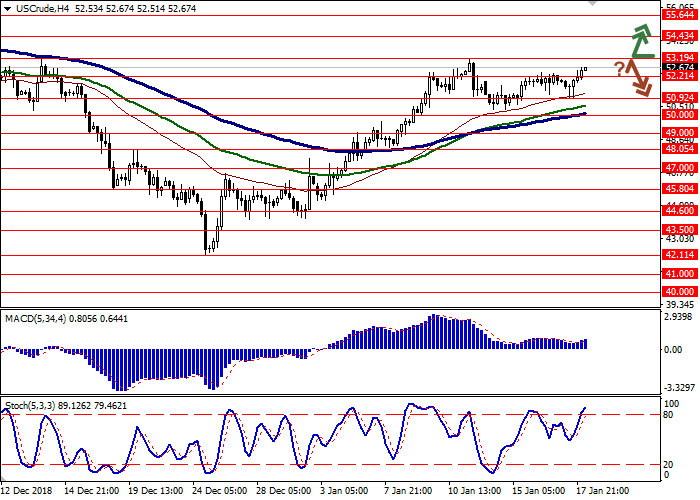
| Key Levels | 49.00, 50.00, 50.92, 52.21, 53.19, 54.43, 55.64 |
| Alternative scenario | |
|---|---|
| Recommendation | SELL STOP |
| Entry Point | 52.15, 51.95 |
| Take Profit | 50.00, 49.00 |
| Stop Loss | 53.00, 53.20 |
| Key Levels | 49.00, 50.00, 50.92, 52.21, 53.19, 54.43, 55.64 |
Current trend
Yesterday, oil prices were flat but the weak upward trend in the short/super-short term maintained.
On Thursday, the fall was due to the EIA report, which reflected that US oil production reached 11.9 million barrels per day (a record figure since 1983), and is likely to continue to grow. Traders doubt that the production cut under the OPEC+ contract will be able to balance the market. As a result, the market did not notice a new drop in US oil reserves by 2.683 million barrels. Now investors wait for the World Economic Forum in Davos with a meeting of Russian energy minister, Alexander Novak, and Saudi Arabian one, Khalid Al-Falih. Probably, the OPEC and partners countries will continue to search for ways to stabilize the oil market.
Today, investors wait for US Baker Hughes Oil Rig Count release.
Support and resistance
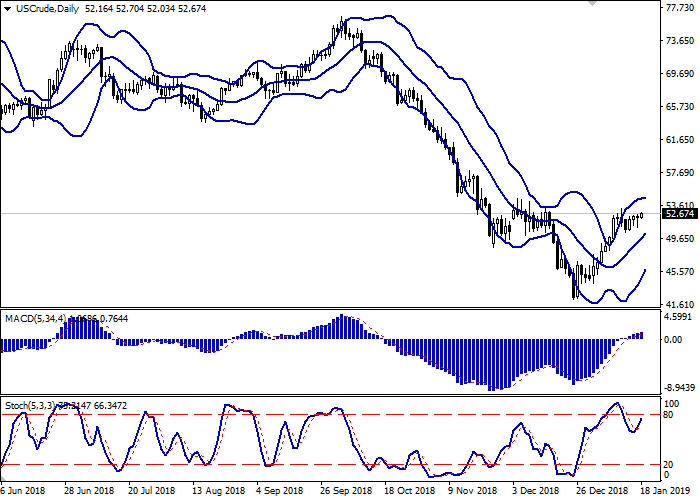
On the daily chart, Bollinger bands grow moderately. The price range narrows, reflecting the uncertain nature of the current upward correction in the short term. MACD is growing, keeping a weak buy signal (the histogram is above the signal line). Stochastic reversed upwards after a short decline at the beginning of the week and is approaching its highs, which limits the upward trend development in the super-short term.
It is better to keep current long positions until the situation becomes clear.
Resistance levels: 53.19, 54.43, 55.64.
Support levels: 52.21, 50.92, 50.00, 49.00.


Trading tips
Long positions can be opened after the breakout of 53.19 with the target at 55.64 or 56.00. Stop loss is 52.21–52.00.
Short positions can be opened after the rebound from 53.19 and the breakdown of 52.21–52.00 with the target at 50.00 or 49.00. Stop loss is 53.00–53.20.
Implementation period: 2–3 days.
Yesterday, oil prices were flat but the weak upward trend in the short/super-short term maintained.
On Thursday, the fall was due to the EIA report, which reflected that US oil production reached 11.9 million barrels per day (a record figure since 1983), and is likely to continue to grow. Traders doubt that the production cut under the OPEC+ contract will be able to balance the market. As a result, the market did not notice a new drop in US oil reserves by 2.683 million barrels. Now investors wait for the World Economic Forum in Davos with a meeting of Russian energy minister, Alexander Novak, and Saudi Arabian one, Khalid Al-Falih. Probably, the OPEC and partners countries will continue to search for ways to stabilize the oil market.
Today, investors wait for US Baker Hughes Oil Rig Count release.
Support and resistance
On the daily chart, Bollinger bands grow moderately. The price range narrows, reflecting the uncertain nature of the current upward correction in the short term. MACD is growing, keeping a weak buy signal (the histogram is above the signal line). Stochastic reversed upwards after a short decline at the beginning of the week and is approaching its highs, which limits the upward trend development in the super-short term.
It is better to keep current long positions until the situation becomes clear.
Resistance levels: 53.19, 54.43, 55.64.
Support levels: 52.21, 50.92, 50.00, 49.00.


Trading tips
Long positions can be opened after the breakout of 53.19 with the target at 55.64 or 56.00. Stop loss is 52.21–52.00.
Short positions can be opened after the rebound from 53.19 and the breakdown of 52.21–52.00 with the target at 50.00 or 49.00. Stop loss is 53.00–53.20.
Implementation period: 2–3 days.


No comments:
Write comments