WTI Crude Oil: mixed dynamics
16 January 2019, 08:58
| Scenario | |
|---|---|
| Timeframe | Intraday |
| Recommendation | BUY STOP |
| Entry Point | 52.25, 52.55 |
| Take Profit | 54.43, 55.00 |
| Stop Loss | 51.00 |
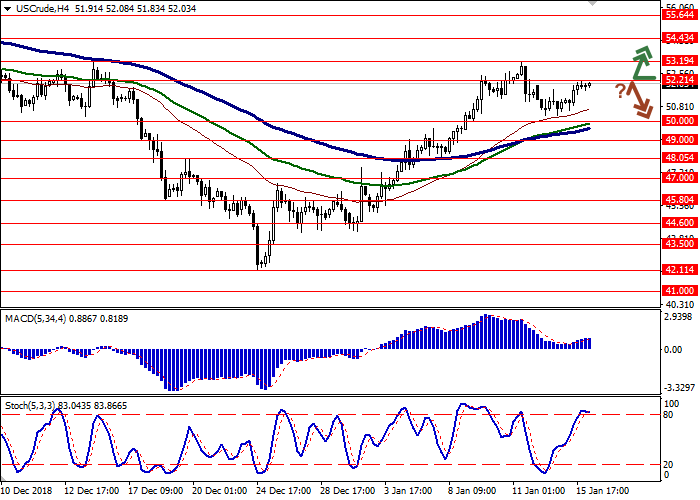
| Key Levels | 47.00, 48.05, 49.00, 50.00, 52.21, 53.19, 54.43, 55.64 |
| Alternative scenario | |
|---|---|
| Recommendation | SELL STOP |
| Entry Point | 50.95 |
| Take Profit | 49.00, 48.05 |
| Stop Loss | 52.00, 52.21 |
| Key Levels | 47.00, 48.05, 49.00, 50.00, 52.21, 53.19, 54.43, 55.64 |
Current trend
Yesterday, oil prices rose, balancing the decline earlier in the week.
The strengthening is due to poor US macroeconomic data. January NY Empire State Manufacturing Index fell from 10.90 to 3.90 points against the forecast of a decline only to 10.75 points. PPI fell by 0.2% MoM in December after rising by 0.1% MoM in November. Analysts expected a decrease of –0.1% MoM. IBD/TIPP Economic Optimism in January fell from 52.6 to 52.3 points against the forecasts of growth to 53.1 points.
API Weekly Crude Oil Stock release barely supported the instrument. By January 11, weekly indicator decreased by 0.56 million barrels after a decrease of 6.27 million barrels in the previous period.
Support and resistance
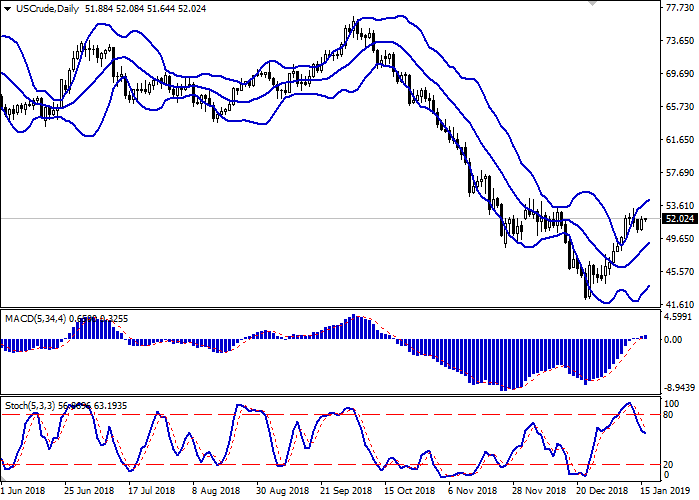
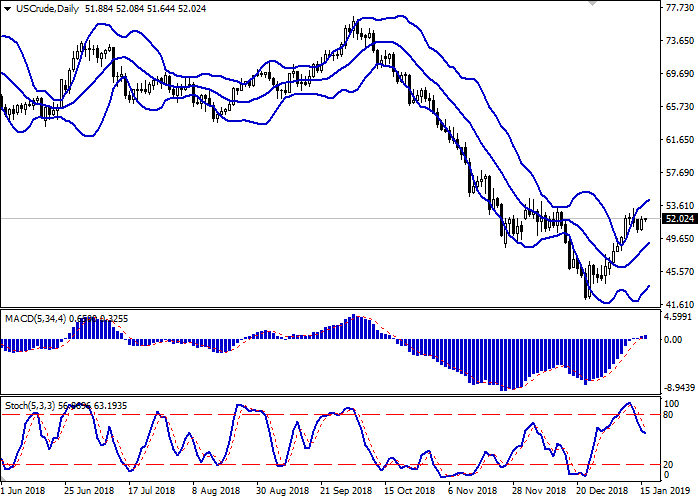
Bollinger bands are growing steadily on the daily chart. The price range is unchanged but remains quite wide for the current activity level. MACD is growing, keeping a weak buy signal (the histogram is above the signal line), and is trying to consolidate above the zero line. Stochastic declines, barely responding to yesterday's restoration of the “bullish” dynamics.
It is better to keep part of the current long positions for some time and wait for additional signals to appear before opening new ones.
Resistance levels: 52.21, 53.19, 54.43, 55.64.
Support levels: 50.00, 49.00, 48.05, 47.00.


Trading tips
Long positions can be opened after the breakout of 52.21–52.50 with the target at 54.43 or 55.00. Stop loss is 51.00. Implementation period: 1–2 days.
Short positions can be opened after the rebound from 52.21 and the breakdown of 51.00 with the target at 49.00 or 48.05. Stop loss is 52.00–52.21. Implementation period: 2–3 days.
Yesterday, oil prices rose, balancing the decline earlier in the week.
The strengthening is due to poor US macroeconomic data. January NY Empire State Manufacturing Index fell from 10.90 to 3.90 points against the forecast of a decline only to 10.75 points. PPI fell by 0.2% MoM in December after rising by 0.1% MoM in November. Analysts expected a decrease of –0.1% MoM. IBD/TIPP Economic Optimism in January fell from 52.6 to 52.3 points against the forecasts of growth to 53.1 points.
API Weekly Crude Oil Stock release barely supported the instrument. By January 11, weekly indicator decreased by 0.56 million barrels after a decrease of 6.27 million barrels in the previous period.
Support and resistance
Bollinger bands are growing steadily on the daily chart. The price range is unchanged but remains quite wide for the current activity level. MACD is growing, keeping a weak buy signal (the histogram is above the signal line), and is trying to consolidate above the zero line. Stochastic declines, barely responding to yesterday's restoration of the “bullish” dynamics.
It is better to keep part of the current long positions for some time and wait for additional signals to appear before opening new ones.
Resistance levels: 52.21, 53.19, 54.43, 55.64.
Support levels: 50.00, 49.00, 48.05, 47.00.


Trading tips
Long positions can be opened after the breakout of 52.21–52.50 with the target at 54.43 or 55.00. Stop loss is 51.00. Implementation period: 1–2 days.
Short positions can be opened after the rebound from 52.21 and the breakdown of 51.00 with the target at 49.00 or 48.05. Stop loss is 52.00–52.21. Implementation period: 2–3 days.


No comments:
Write comments