
NZD/USD: mixed dynamics
25 January 2019, 08:52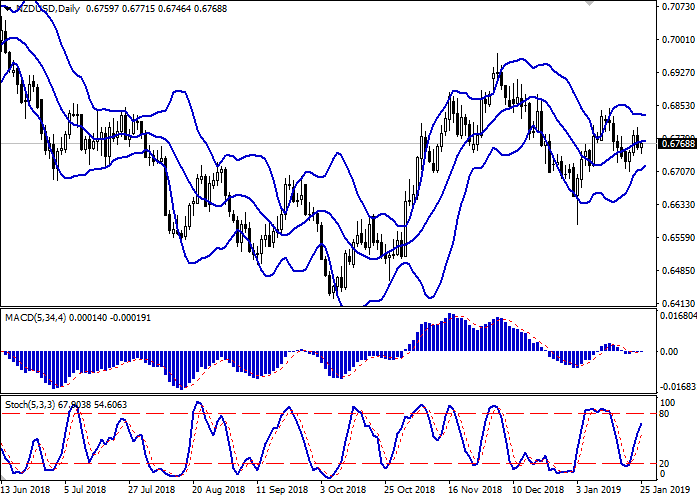
| Scenario | |
|---|---|
| Timeframe | Intraday |
| Recommendation | BUY STOP |
| Entry Point | 0.6795, 0.6810 |
| Take Profit | 0.6847, 0.6878 |
| Stop Loss | 0.6760 |
| Key Levels | 0.6662, 0.6704, 0.6726, 0.6746, 0.6789, 0.6807, 0.6847, 0.6878 |
| Alternative scenario | |
|---|---|
| Recommendation | SELL STOP |
| Entry Point | 0.6740 |
| Take Profit | 0.6704, 0.6700 |
| Stop Loss | 0.6770 |
| Key Levels | 0.6662, 0.6704, 0.6726, 0.6746, 0.6789, 0.6807, 0.6847, 0.6878 |
Current trend
Yesterday, NZD fell against USD, retreating from the renewed highs since January 16.
Investors are focused on the continuing Shutdown of the government and data from the US labor market. Currently, Congress is attempting to overcome the crisis. The Republican Party has prepared a draft consensus decision, according to which 5.7$ billion will be allocated to build a wall on the border with Mexico, but at the same time, the legal protection regime will be extended for 700K migrants that have illegally entered the United States, as well as refugees. An alternative project of the Democratic Party provides for the allocation of 5.7$ billion to ensure the security of external borders, but without the construction of the wall. The government can resume work in full if one of the projects is agreed upon.
Support and resistance
On the daily chart, Bollinger bands move flat. The price range narrows, reflecting the mixed nature of trading in recent weeks. MACD indicator draws out along the zero line, indicating an approximate balance of “bullish” and “bearish” forces in the market. Stochastic is directed upwards and is rapidly approaching its highs, which indicates that NZD can become overbought in the super short term.
The current readings of the indicators do not contradict the further development of the “bullish” trend in the short/super short term.
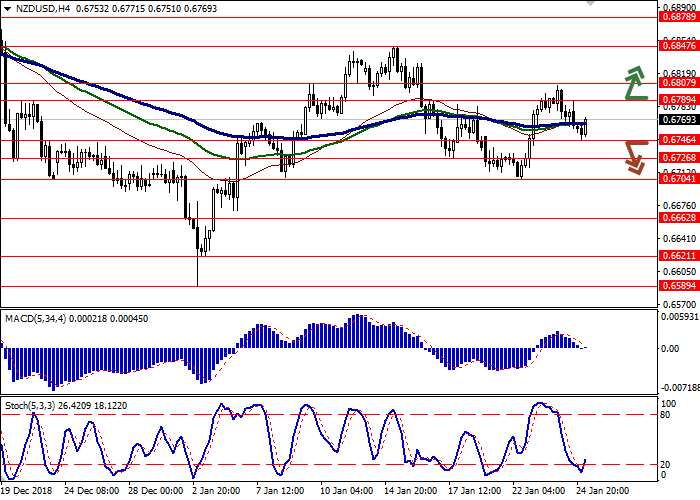
Resistance levels: 0.6789, 0.6807, 0.6847, 0.6878.
Support levels: 0.6746, 0.6726, 0.6704, 0.6662.

Trading tips
Long positions can be opened after the breakout of 0.6789 or 0.6807 with the target at 0.6847 or 0.6878. Stop loss is 0.6780–0.6760. Implementation period: 2–3 days.
Short positions can be opened after the breakdown of 0.6746 with the targets at 0.6704–0.6700. Stop loss is 0.6770. Implementation period: 1–2 days.
Yesterday, NZD fell against USD, retreating from the renewed highs since January 16.
Investors are focused on the continuing Shutdown of the government and data from the US labor market. Currently, Congress is attempting to overcome the crisis. The Republican Party has prepared a draft consensus decision, according to which 5.7$ billion will be allocated to build a wall on the border with Mexico, but at the same time, the legal protection regime will be extended for 700K migrants that have illegally entered the United States, as well as refugees. An alternative project of the Democratic Party provides for the allocation of 5.7$ billion to ensure the security of external borders, but without the construction of the wall. The government can resume work in full if one of the projects is agreed upon.
Support and resistance
On the daily chart, Bollinger bands move flat. The price range narrows, reflecting the mixed nature of trading in recent weeks. MACD indicator draws out along the zero line, indicating an approximate balance of “bullish” and “bearish” forces in the market. Stochastic is directed upwards and is rapidly approaching its highs, which indicates that NZD can become overbought in the super short term.
The current readings of the indicators do not contradict the further development of the “bullish” trend in the short/super short term.
Resistance levels: 0.6789, 0.6807, 0.6847, 0.6878.
Support levels: 0.6746, 0.6726, 0.6704, 0.6662.
Trading tips
Long positions can be opened after the breakout of 0.6789 or 0.6807 with the target at 0.6847 or 0.6878. Stop loss is 0.6780–0.6760. Implementation period: 2–3 days.
Short positions can be opened after the breakdown of 0.6746 with the targets at 0.6704–0.6700. Stop loss is 0.6770. Implementation period: 1–2 days.


No comments:
Write comments