
AUD/USD: Australian dollar is going down
25 January 2019, 09:18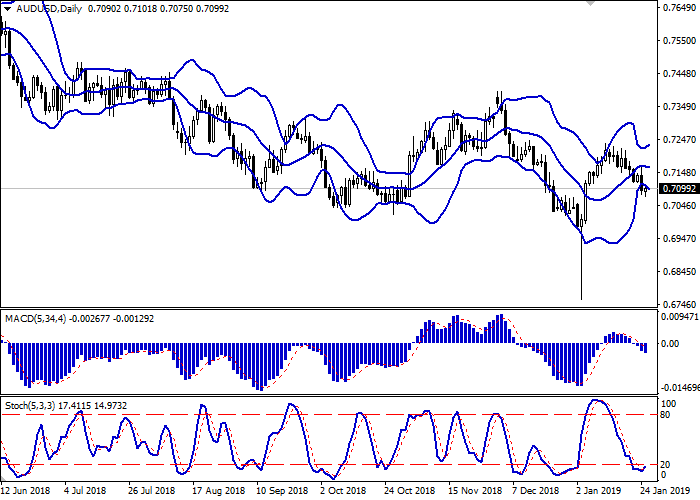
| Scenario | |
|---|---|
| Timeframe | Intraday |
| Recommendation | BUY STOP |
| Entry Point | 0.7120 |
| Take Profit | 0.7165, 0.7200 |
| Stop Loss | 0.7080 |
| Key Levels | 0.7000, 0.7027, 0.7053, 0.7075, 0.7115, 0.7145, 0.7165, 0.7200 |
| Alternative scenario | |
|---|---|
| Recommendation | SELL STOP |
| Entry Point | 0.7070 |
| Take Profit | 0.7000, 0.6973 |
| Stop Loss | 0.7100, 0.7115 |
| Key Levels | 0.7000, 0.7027, 0.7053, 0.7075, 0.7115, 0.7145, 0.7165, 0.7200 |
Current trend
AUD showed a noticeable decline against USD on Thursday, having updated local lows of January 4. At the same time, in the morning the instrument was trading higher, which was due to the publication of a strong report on the Australian labor market for December.
The unemployment rate dropped to 5.0%, and the employment rate rose by 21.6K. However, general employment growth was achieved due to an increase in the number of part-time working citizens (24.6K). At the same time, the number of full-time workers fell for the second month in a row, this time by 3K. Thus, the state of the labor market in Australia can't be called stable.
Today, the instrument is trading with a raise. Due to the half-empty macroeconomic calendar, investors can concentrate on fixing short profits on AUD.
Support and resistance
Bollinger Bands in D1 chart demonstrate flat dynamics. The price range is expanding, but it still fails to catch the development of the current “bearish” trend, which indicates the risks of corrective growth. MACD is going down keeping a fairly stable sell signal (located below the signal line). Stochastic, having reached its lows, is trying to reverse upwards, indicating an oversold instrument in the ultra-short term.
It is necessary to wait until the upward correction signals are confirmed in the near future.
Resistance levels: 0.7115, 0.7145, 0.7165, 0.7200.
Support levels: 0.7075, 0.7053, 0.7027, 0.7000.
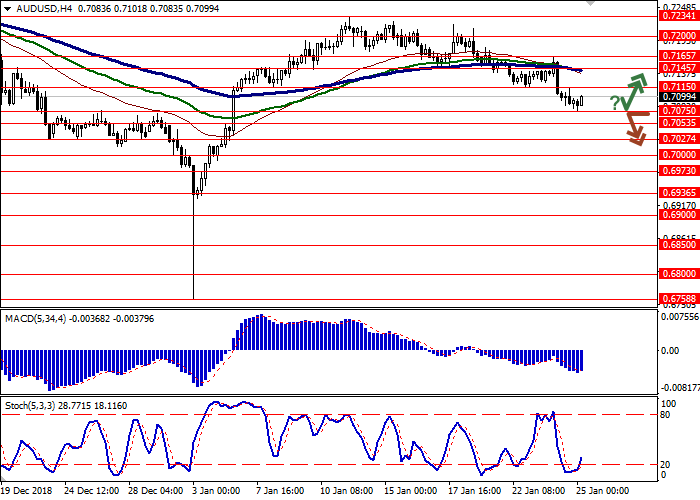

Trading tips
To open long positions, one can rely on the rebound from 0.7075 as from support with the subsequent breakout of 0.7115. Take profit — 0.7165 or 0.7200. Stop loss — 0.7080.
A breakdown of 0.7075 may be a signal to further sales with target at 0.7000 or 0.6973. Stop loss — 0.7100 or 0.7115.
Implementation period: 2-3 days.
AUD showed a noticeable decline against USD on Thursday, having updated local lows of January 4. At the same time, in the morning the instrument was trading higher, which was due to the publication of a strong report on the Australian labor market for December.
The unemployment rate dropped to 5.0%, and the employment rate rose by 21.6K. However, general employment growth was achieved due to an increase in the number of part-time working citizens (24.6K). At the same time, the number of full-time workers fell for the second month in a row, this time by 3K. Thus, the state of the labor market in Australia can't be called stable.
Today, the instrument is trading with a raise. Due to the half-empty macroeconomic calendar, investors can concentrate on fixing short profits on AUD.
Support and resistance
Bollinger Bands in D1 chart demonstrate flat dynamics. The price range is expanding, but it still fails to catch the development of the current “bearish” trend, which indicates the risks of corrective growth. MACD is going down keeping a fairly stable sell signal (located below the signal line). Stochastic, having reached its lows, is trying to reverse upwards, indicating an oversold instrument in the ultra-short term.
It is necessary to wait until the upward correction signals are confirmed in the near future.
Resistance levels: 0.7115, 0.7145, 0.7165, 0.7200.
Support levels: 0.7075, 0.7053, 0.7027, 0.7000.
Trading tips
To open long positions, one can rely on the rebound from 0.7075 as from support with the subsequent breakout of 0.7115. Take profit — 0.7165 or 0.7200. Stop loss — 0.7080.
A breakdown of 0.7075 may be a signal to further sales with target at 0.7000 or 0.6973. Stop loss — 0.7100 or 0.7115.
Implementation period: 2-3 days.


No comments:
Write comments