
Brent Crude Oil: general analysis
09 January 2019, 12:01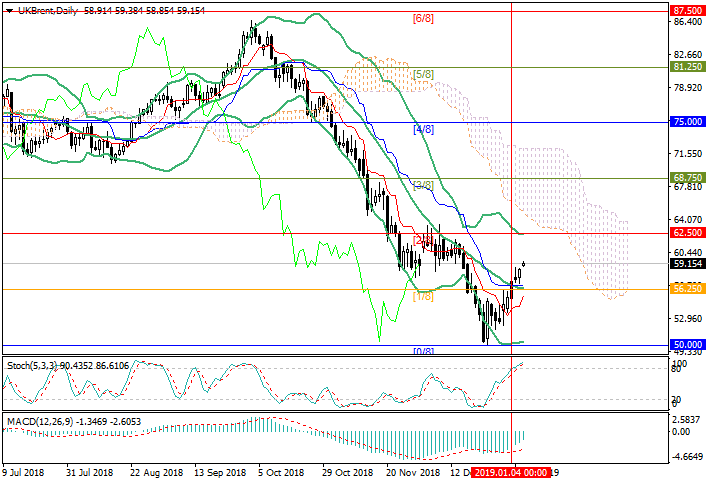
| Scenario | |
|---|---|
| Timeframe | Weekly |
| Recommendation | BUY STOP |
| Entry Point | 59.50 |
| Take Profit | 60.93, 62.50 |
| Stop Loss | 58.80 |
| Key Levels | 50.00, 53.12, 56.25, 60.93, 62.50 |
| Alternative scenario | |
|---|---|
| Recommendation | SELL STOP |
| Entry Point | 57.80 |
| Take Profit | 56.25 |
| Stop Loss | 58.40 |
| Key Levels | 50.00, 53.12, 56.25, 60.93, 62.50 |
Current trend
This week, oil prices are rising, and they have exceeded $59 per barrel by now. The main growth driver is US-Chinese trade negotiations, the next round of which began on Monday in Beijing. According to The Wall Street Journal, the parties managed to make significant progress on the issue of China buying goods and services in the United States but have not yet agreed to complete the deal. Nevertheless, the hope of ending the trade war in the foreseeable future remains.
The latest API report turned out to be ambiguous. US oil reserves declined again, this time by 6.27 million barrels. However, gasoline inventories rose by 5.5 million barrels, and distillate stocks rose to 10.2 million barrels. In the evening, the EIA report will be published, the indicator is expected to decrease by 2.80 million barrels, which may provide additional support to prices. On the other hand, in case of failure of today's negotiations on the financing of the US government, a correction is possible.
Support and resistance
The price broke out the level of 56.25 (Murrey [1/8], the middle line of Bollinger bands) and can grow to the levels of 60.93 (Murrey [7/8], H4), 62.50 (Murrey [2/8]). However, if the EIA data does not meet investors' expectations, a return to level 56.25 is possible.
Technical indicators do not give a clear signal. MACD histogram is decreasing in the negative zone. Stochastic entered the overbought zone and may reverse downwards.
Support levels: 56.25, 53.12, 50.00.
Resistance levels: 60.93, 62.50.

Trading tips
Long positions can be opened from 59.70 with the targets at 60.93, 62.50 and stop loss around 58.80.
Short positions can be opened from 57.80 with the target at 56.25 and stop loss 58.40.
Implementation period: 4–5 days.
This week, oil prices are rising, and they have exceeded $59 per barrel by now. The main growth driver is US-Chinese trade negotiations, the next round of which began on Monday in Beijing. According to The Wall Street Journal, the parties managed to make significant progress on the issue of China buying goods and services in the United States but have not yet agreed to complete the deal. Nevertheless, the hope of ending the trade war in the foreseeable future remains.
The latest API report turned out to be ambiguous. US oil reserves declined again, this time by 6.27 million barrels. However, gasoline inventories rose by 5.5 million barrels, and distillate stocks rose to 10.2 million barrels. In the evening, the EIA report will be published, the indicator is expected to decrease by 2.80 million barrels, which may provide additional support to prices. On the other hand, in case of failure of today's negotiations on the financing of the US government, a correction is possible.
Support and resistance
The price broke out the level of 56.25 (Murrey [1/8], the middle line of Bollinger bands) and can grow to the levels of 60.93 (Murrey [7/8], H4), 62.50 (Murrey [2/8]). However, if the EIA data does not meet investors' expectations, a return to level 56.25 is possible.
Technical indicators do not give a clear signal. MACD histogram is decreasing in the negative zone. Stochastic entered the overbought zone and may reverse downwards.
Support levels: 56.25, 53.12, 50.00.
Resistance levels: 60.93, 62.50.
Trading tips
Long positions can be opened from 59.70 with the targets at 60.93, 62.50 and stop loss around 58.80.
Short positions can be opened from 57.80 with the target at 56.25 and stop loss 58.40.
Implementation period: 4–5 days.


No comments:
Write comments