
Adobe Systems Inc. (ADBE/NASD): general analysis
09 January 2019, 12:26
| Scenario | |
|---|---|
| Timeframe | Intraday |
| Recommendation | BUY STOP |
| Entry Point | 234.00 |
| Take Profit | 242.00, 250.00, 255.00 |
| Stop Loss | 231.35, 226.00 |
| Key Levels | 205.00, 214.00, 224.00, 234.00, 242.00, 252.00 |
| Alternative scenario | |
|---|---|
| Recommendation | SELL STOP |
| Entry Point | 223.90 |
| Take Profit | 210.00, 205.00 |
| Stop Loss | 232.00 |
| Key Levels | 205.00, 214.00, 224.00, 234.00, 242.00, 252.00 |
Current trend
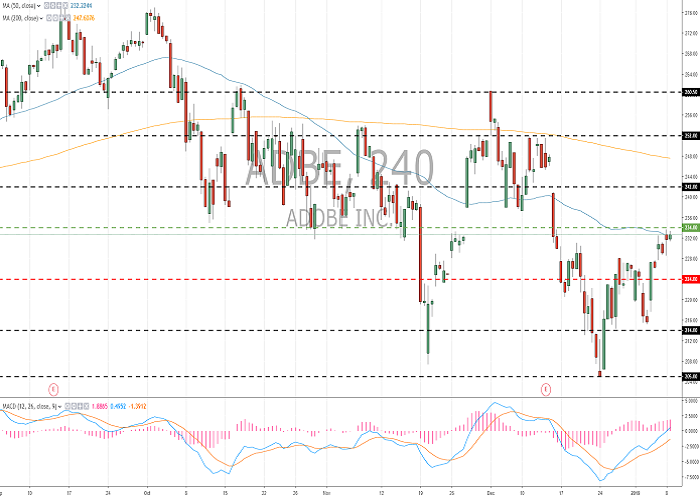
Shares of Adobe continue to strengthen form the 10-month low of December 24, renewed after the publication of quarterly results. In 2018, the company's revenue growth exceeded 20%, continuing the trend of the past few years. Strong demand and an increase in business margins let the market expect an increase in revenues also at the level of 20% in the current quarter and in 2019.
During the last week, Adobe grew by 2,85% against the growth of S&P 500 index by 2,70%.
Support and resistance
The technical picture is ambiguous. The issuer is moving sideways. The key support and resistance levels are 224.00 and 234.00. There is a potential for recovery. Indicators do not give accurate signals: the price is testing MA (50); MACD histogram is in the positive zone. It is better to open the positions from the key levels.
A comparative analysis of company multipliers and competing companies in the industry indicates the neutrality of #ADBE.
Resistance levels: 234.00, 242.00, 252.00.
Support levels: 224.00, 214.00, 205.00.
Trading tips
Long positions can be opened after the price is set above the level of 234.00. The closing of the profitable positions is possible at the levels of 242.00, 250.00 and 255.00. Stop loss is 226.00.
Short positions can be opened after the price is set below the level of 224.00 with the targets at 210.00–205.00. Stop loss is 232.00.
Implementation period: 3 days.


No comments:
Write comments