
XAU/USD: general review
12 December 2018, 10:16
| Scenario | |
|---|---|
| Timeframe | Intraday |
| Recommendation | SELL STOP |
| Entry Point | 1242.00 |
| Take Profit | 1236.25, 1230.50 |
| Stop Loss | 1247.30 |
| Key Levels | 1200.15, 1211.90, 1219.38, 1228.00, 1238.88, 1244.81, 1250.72, 1257.49, 1267.16 |
| Alternative scenario | |
|---|---|
| Recommendation | BUY STOP |
| Entry Point | 1247.35 |
| Take Profit | 1257.50 |
| Stop Loss | 1243.90 |
| Key Levels | 1200.15, 1211.90, 1219.38, 1228.00, 1238.88, 1244.81, 1250.72, 1257.49, 1267.16 |
Current trend
Gold has been trading near its highs since July this year, testing an important psychological level of 1250.00.
On Tuesday, the instrument dropped after the publication of a report by the US Department of Labor on producer prices. After rising by 0.6% in October, wholesale prices rose by 0.1% in November, which came as a surprise to the market. In annual terms, PPI rose by 2.5%. Positive statistics on producer prices brings the Fed to the target level of inflation, which is an argument in favor of tightening monetary policy.
Today, investors expect the publication of the US Consumer Price Index at 15:30 (GMT+2). A moderate growth rate will have a positive impact on personal income, the level of consumption in the US and will strengthen USD. At the same time, a more significant increase in the indicator will signal an overheating of the economy, which the Fed chairman fears.
Support and resistance
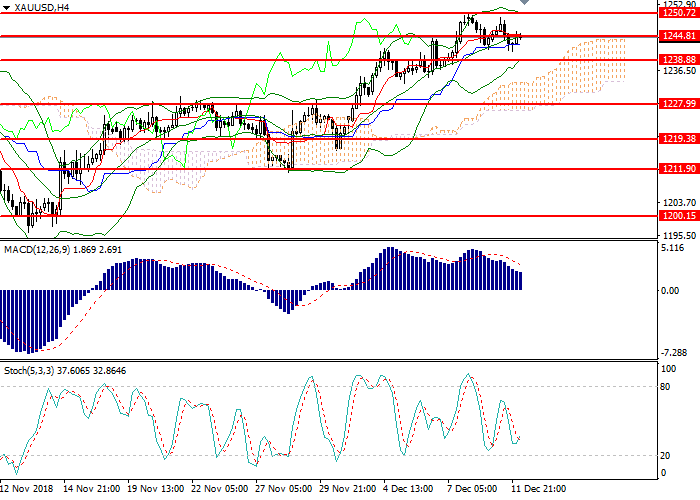
On H4 chart the pair corrected to the moving average of Bollinger Bands. The indicator has reversed sideways, and the price range reduced, indicating the continuation of the corrective trend. MACD histogram is in positive zone, keeping the buy signal. Stochastic is correcting at the border of the oversold area, the signal for opening positions is not formed.
Resistance levels: 1250.72, 1257.49, 1267.16.
Support levels: 1244.81, 1238.88, 1228.00, 1219.38, 1211.90, 1200.15.
Trading tips
Short positions could be opened below 1242.05 with targets at 1236.25, 1230.50 and stop loss at 1247.30.
Long positions may be opened above 1247.30 with target at 1257.50 and stop loss at 1243.90.
Implementation time: 1-3 days.
Gold has been trading near its highs since July this year, testing an important psychological level of 1250.00.
On Tuesday, the instrument dropped after the publication of a report by the US Department of Labor on producer prices. After rising by 0.6% in October, wholesale prices rose by 0.1% in November, which came as a surprise to the market. In annual terms, PPI rose by 2.5%. Positive statistics on producer prices brings the Fed to the target level of inflation, which is an argument in favor of tightening monetary policy.
Today, investors expect the publication of the US Consumer Price Index at 15:30 (GMT+2). A moderate growth rate will have a positive impact on personal income, the level of consumption in the US and will strengthen USD. At the same time, a more significant increase in the indicator will signal an overheating of the economy, which the Fed chairman fears.
Support and resistance
On H4 chart the pair corrected to the moving average of Bollinger Bands. The indicator has reversed sideways, and the price range reduced, indicating the continuation of the corrective trend. MACD histogram is in positive zone, keeping the buy signal. Stochastic is correcting at the border of the oversold area, the signal for opening positions is not formed.
Resistance levels: 1250.72, 1257.49, 1267.16.
Support levels: 1244.81, 1238.88, 1228.00, 1219.38, 1211.90, 1200.15.
Trading tips
Short positions could be opened below 1242.05 with targets at 1236.25, 1230.50 and stop loss at 1247.30.
Long positions may be opened above 1247.30 with target at 1257.50 and stop loss at 1243.90.
Implementation time: 1-3 days.


No comments:
Write comments