
WTI Crude Oil: oil prices are consolidating
17 December 2018, 09:49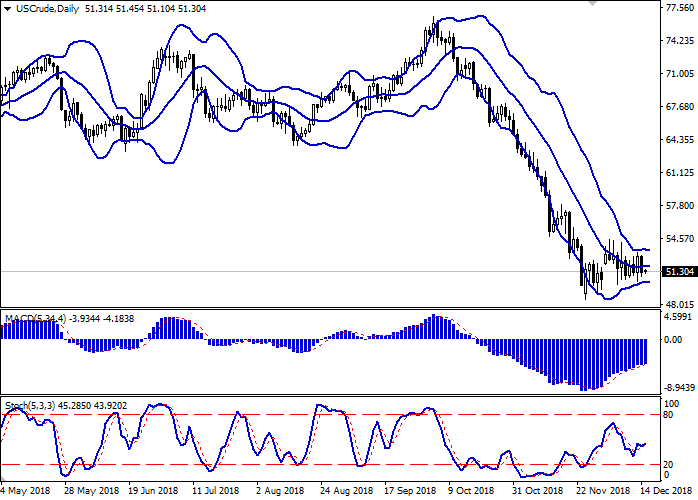
| Scenario | |
|---|---|
| Timeframe | Intraday |
| Recommendation | BUY STOP |
| Entry Point | 52.45 |
| Take Profit | 55.00, 55.64 |
| Stop Loss | 51.30 |
| Key Levels | 48.09, 49.00, 50.00, 52.38, 53.30, 54.43, 55.64 |
| Alternative scenario | |
|---|---|
| Recommendation | SELL STOP |
| Entry Point | 49.90 |
| Take Profit | 48.09, 47.50 |
| Stop Loss | 51.00, 51.20 |
| Key Levels | 48.09, 49.00, 50.00, 52.38, 53.30, 54.43, 55.64 |
Current trend
Prices for WTI crude oil showed a steady decline on Friday, offsetting the growth of the instrument the day before. Certain pressure on quotes at the end of the week was made by Iran’s rather harsh statements about the intention to make a discount on oil for Asian buyers in the amount of 1 dollar per barrel.
In turn, Baker Hughes report published on Friday on active oil platforms in the US was able to provide the instrument with little support. At the end of last week, the number of drilling rigs decreased from 877 to 873 units after a decrease by 10 units two weeks ago.
Support and resistance
Bollinger Bands in D1 chart demonstrate flat dynamics. The price range remains quite narrow, but fully corresponds to the real dynamics observed in the market. MACD indicator is growing keeping a stable buy signal (located above the signal line). Stochastic tends to flat dynamics, being located approximately in the center of its working area.
To open new positions, it is necessary to wait for the additional trade signals to appear.
Resistance levels: 52.38, 53.30, 54.43, 55.64.
Support levels: 50.00, 49.00, 48.09.


Trading tips
To open long positions, one can rely on the breakout of 52.38. Take profit — 55.00 or 55.64. Stop loss — 51.30.
A breakdown of 50.00 may be a signal for new sales with target at 48.09 or 47.50. Stop loss — 51.00 or 51.20.
Implementation period: 2-3 days.
Prices for WTI crude oil showed a steady decline on Friday, offsetting the growth of the instrument the day before. Certain pressure on quotes at the end of the week was made by Iran’s rather harsh statements about the intention to make a discount on oil for Asian buyers in the amount of 1 dollar per barrel.
In turn, Baker Hughes report published on Friday on active oil platforms in the US was able to provide the instrument with little support. At the end of last week, the number of drilling rigs decreased from 877 to 873 units after a decrease by 10 units two weeks ago.
Support and resistance
Bollinger Bands in D1 chart demonstrate flat dynamics. The price range remains quite narrow, but fully corresponds to the real dynamics observed in the market. MACD indicator is growing keeping a stable buy signal (located above the signal line). Stochastic tends to flat dynamics, being located approximately in the center of its working area.
To open new positions, it is necessary to wait for the additional trade signals to appear.
Resistance levels: 52.38, 53.30, 54.43, 55.64.
Support levels: 50.00, 49.00, 48.09.
Trading tips
To open long positions, one can rely on the breakout of 52.38. Take profit — 55.00 or 55.64. Stop loss — 51.30.
A breakdown of 50.00 may be a signal for new sales with target at 48.09 or 47.50. Stop loss — 51.00 or 51.20.
Implementation period: 2-3 days.


No comments:
Write comments