USD/JPY: the dollar is dropping
10 December 2018, 09:50
| Scenario | |
|---|---|
| Timeframe | Intraday |
| Recommendation | BUY |
| Entry Point | 112.60 |
| Take Profit | 113.00, 113.18 |
| Stop Loss | 112.21 |
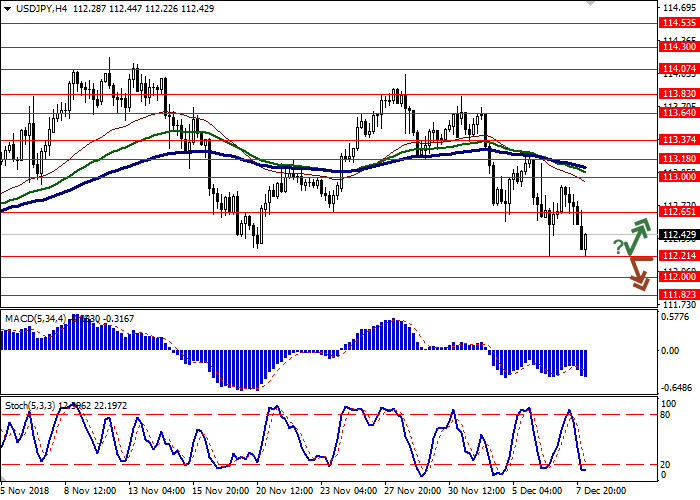
| Key Levels | 111.61, 111.82, 112.00, 112.21, 112.65, 113.00, 113.18, 113.37 |
| Alternative scenario | |
|---|---|
| Recommendation | SELL STOP |
| Entry Point | 112.15 |
| Take Profit | 111.82, 111.61 |
| Stop Loss | 112.50 |
| Key Levels | 111.61, 111.82, 112.00, 112.21, 112.65, 113.00, 113.18, 113.37 |
Current trend
USD showed a slight decrease against JPY on Friday, despite the fact that during the day the instrument was trading upwards.
Friday's Japanese economic data were ambiguous. The household spending index in October grew by 1.8% QoQ after a decrease by 4.5% QoQ a month earlier and fell by 0.3% YoY. Average Cash Earnings increased by 1.5% instead of the expected 1.0%. Also, at the end of the previous week, the head of the Bank of Japan, Haruhiko Kuroda, reiterated the need to preserve ultra-soft monetary policy.
With the opening of the American session, the focus of investors shifted to the November report on the US labor market, which was the reason for USD weakening. Nonfarm Payrolls in November increased by only 155K, after rising by 237K in October, with a forecast of an increase of 200K.
Support and resistance
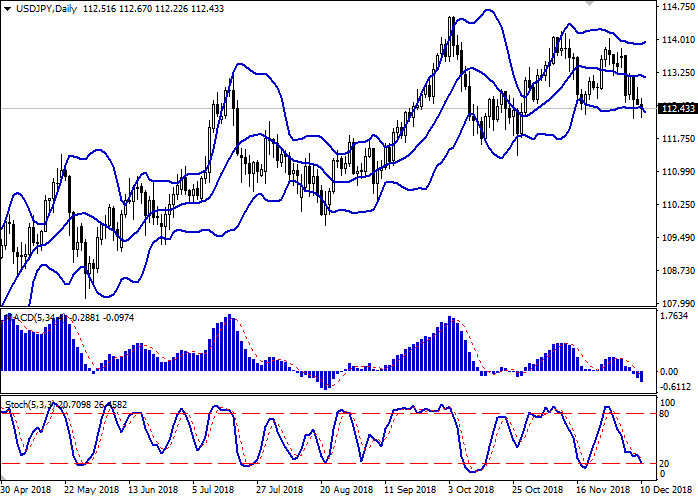
Bollinger Bands in D1 chart demonstrate a slight decrease. The price range is widening but does not conform to the development of the "bearish" trend in the short term. MACD is declining keeping a stable sell signal (located below the signal line). Stochastic demonstrates a similar trend but it approaches its minimum levels, reflecting the risks associated with oversold USD in the ultra-short term.
Existing short positions should be kept until the situation clears up.
Resistance levels: 112.65, 113.00, 113.18, 113.37.
Support levels: 112.21, 112.00, 111.82, 111.61.


Trading tips
To open long positions, one can rely on the rebound from the support level of 112.21 with the subsequent breakout of 112.50. Take profit — 113.00 or 113.18. Stop loss — 112.21. Implementation period: 2-3 days.
A confident breakdown of 112.21 may become a signal to further sales with target at 111.82 or 111.61. Stop loss — 112.50. Implementation period: 1-2 days.
USD showed a slight decrease against JPY on Friday, despite the fact that during the day the instrument was trading upwards.
Friday's Japanese economic data were ambiguous. The household spending index in October grew by 1.8% QoQ after a decrease by 4.5% QoQ a month earlier and fell by 0.3% YoY. Average Cash Earnings increased by 1.5% instead of the expected 1.0%. Also, at the end of the previous week, the head of the Bank of Japan, Haruhiko Kuroda, reiterated the need to preserve ultra-soft monetary policy.
With the opening of the American session, the focus of investors shifted to the November report on the US labor market, which was the reason for USD weakening. Nonfarm Payrolls in November increased by only 155K, after rising by 237K in October, with a forecast of an increase of 200K.
Support and resistance
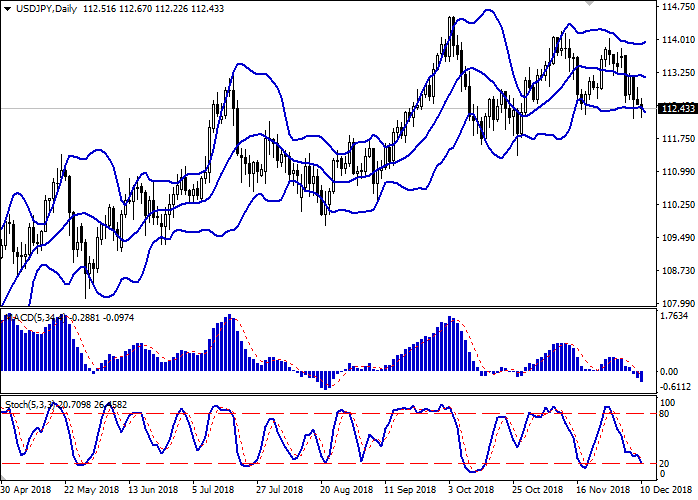
Bollinger Bands in D1 chart demonstrate a slight decrease. The price range is widening but does not conform to the development of the "bearish" trend in the short term. MACD is declining keeping a stable sell signal (located below the signal line). Stochastic demonstrates a similar trend but it approaches its minimum levels, reflecting the risks associated with oversold USD in the ultra-short term.
Existing short positions should be kept until the situation clears up.
Resistance levels: 112.65, 113.00, 113.18, 113.37.
Support levels: 112.21, 112.00, 111.82, 111.61.


Trading tips
To open long positions, one can rely on the rebound from the support level of 112.21 with the subsequent breakout of 112.50. Take profit — 113.00 or 113.18. Stop loss — 112.21. Implementation period: 2-3 days.
A confident breakdown of 112.21 may become a signal to further sales with target at 111.82 or 111.61. Stop loss — 112.50. Implementation period: 1-2 days.


No comments:
Write comments