
USD/CHF: the pair is trading in both directions
14 December 2018, 09:46
| Scenario | |
|---|---|
| Timeframe | Intraday |
| Recommendation | BUY STOP |
| Entry Point | 0.9955 |
| Take Profit | 1.0027, 1.0050 |
| Stop Loss | 0.9920 |
| Key Levels | 0.9836, 0.9861, 0.9907, 0.9926, 0.9951, 0.9980, 1.0000, 1.0027, 1.0050 |
| Alternative scenario | |
|---|---|
| Recommendation | SELL STOP |
| Entry Point | 0.9900 |
| Take Profit | 0.9836 |
| Stop Loss | 0.9940 |
| Key Levels | 0.9836, 0.9861, 0.9907, 0.9926, 0.9951, 0.9980, 1.0000, 1.0027, 1.0050 |
Current trend
USD showed a slight increase against CHF on Thursday, continuing a slowdown after active growth of the instrument on December 11.
The traders are focused on US-China trade conflict. Recently China began the purchase of American agricultural products, as was agreed at the meeting of Xi Jinping and Donald Trump at the G20 summit. The total volume of purchases of soybeans was about 2 million tons, and their supplies should begin in Q1 2019. Thus, pressure on the American agricultural sector is decreasing, and general trade tensions are alleviated, which supports the hope of an early conclusion of the US-China trade deal.
The minutes of the meeting of the Swiss National Bank published on Thursday only slightly influenced the dynamics of the instrument. As expected, the SNB rate was kept unchanged at –0.75%. At the same time, the regulator lowered inflation forecasts for 2019 and 2020, noting the overall reduction in risks for the economy.
Support and resistance
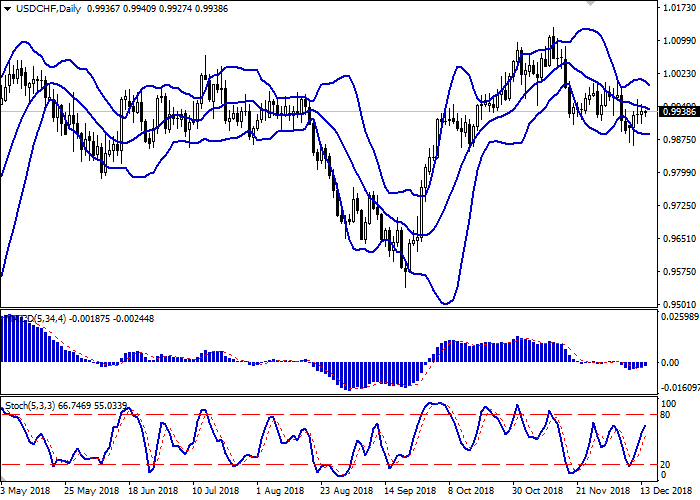
Bollinger Bands in D1 chart demonstrate a gradual decrease. The price range is narrowing, reflecting ambiguous dynamics of trading in the short term. MACD is growing, keeping a weak buy signal (located above the signal line). Stochastic keeps a confident upward direction but is approaching its maximum levels rapidly.
The current showings of the indicators do not contradict the further development of the "bullish" trend.
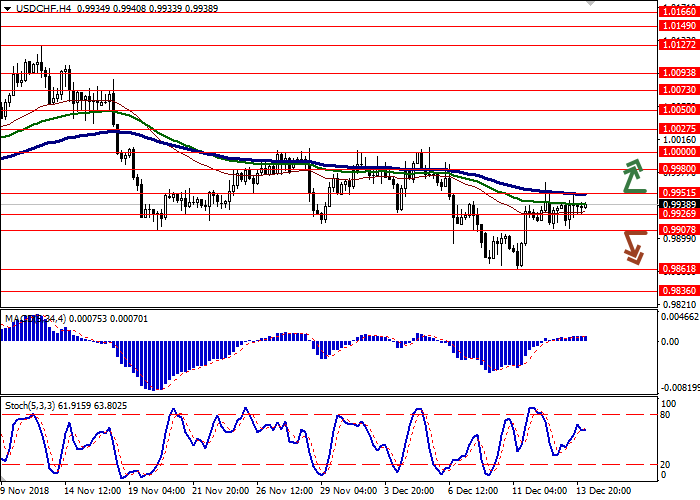
Resistance levels: 0.9951, 0.9980, 1.0000, 1.0027, 1.0050.
Support levels: 0.9926, 0.9907, 0.9861, 0.9836.
Trading tips
To open long positions, one can rely on the breakout of 0.9951. Take profit – 1.0027 or 1.0050. Stop loss — 0.9920 or 0.9910.
A breakdown of 0.9907 may become a signal for returning to sales with target at 0.9836. Stop loss — 0.9940.
Implementation period: 2-3 days.
USD showed a slight increase against CHF on Thursday, continuing a slowdown after active growth of the instrument on December 11.
The traders are focused on US-China trade conflict. Recently China began the purchase of American agricultural products, as was agreed at the meeting of Xi Jinping and Donald Trump at the G20 summit. The total volume of purchases of soybeans was about 2 million tons, and their supplies should begin in Q1 2019. Thus, pressure on the American agricultural sector is decreasing, and general trade tensions are alleviated, which supports the hope of an early conclusion of the US-China trade deal.
The minutes of the meeting of the Swiss National Bank published on Thursday only slightly influenced the dynamics of the instrument. As expected, the SNB rate was kept unchanged at –0.75%. At the same time, the regulator lowered inflation forecasts for 2019 and 2020, noting the overall reduction in risks for the economy.
Support and resistance
Bollinger Bands in D1 chart demonstrate a gradual decrease. The price range is narrowing, reflecting ambiguous dynamics of trading in the short term. MACD is growing, keeping a weak buy signal (located above the signal line). Stochastic keeps a confident upward direction but is approaching its maximum levels rapidly.
The current showings of the indicators do not contradict the further development of the "bullish" trend.
Resistance levels: 0.9951, 0.9980, 1.0000, 1.0027, 1.0050.
Support levels: 0.9926, 0.9907, 0.9861, 0.9836.
Trading tips
To open long positions, one can rely on the breakout of 0.9951. Take profit – 1.0027 or 1.0050. Stop loss — 0.9920 or 0.9910.
A breakdown of 0.9907 may become a signal for returning to sales with target at 0.9836. Stop loss — 0.9940.
Implementation period: 2-3 days.


No comments:
Write comments