
USD/CAD: the instrument is rising
18 December 2018, 09:47
| Scenario | |
|---|---|
| Timeframe | Intraday |
| Recommendation | BUY STOP |
| Entry Point | 1.3425 |
| Take Profit | 1.3500 |
| Stop Loss | 1.3380 |
| Key Levels | 1.3241, 1.3264, 1.3321, 1.3368, 1.3419, 1.3443, 1.3479, 1.3500 |
| Alternative scenario | |
|---|---|
| Recommendation | SELL STOP |
| Entry Point | 1.3360 |
| Take Profit | 1.3264, 1.3241 |
| Stop Loss | 1.3400 |
| Key Levels | 1.3241, 1.3264, 1.3321, 1.3368, 1.3419, 1.3443, 1.3479, 1.3500 |
Current trend
USD rose against CAD on Monday, continuing to develop the "bullish" momentum that emerged at the end of the last trading week.
Against the background of a half-empty macroeconomic calendar at the beginning of the new week, investor attention was focused on fairly strong statistics on the volume of US industrial production, published last Friday. In November, the indicator rose by 0.6% after a decline by 0.2% a month earlier. Today, the bullish impulse has somewhat weakened, as traders pay attention to weak data on business activity and the upcoming Fed meeting, after which the regulator may take a pause in the interest rate increase cycle. Also, investors expect tomorrow's publication of a block of statistics on consumer inflation from Canada.
NY Empire State Manufacturing Index in December showed a decrease from 23.30 to 10.90 points, which was noticeably worse than analytical forecast of 20.10 points.
Support and resistance
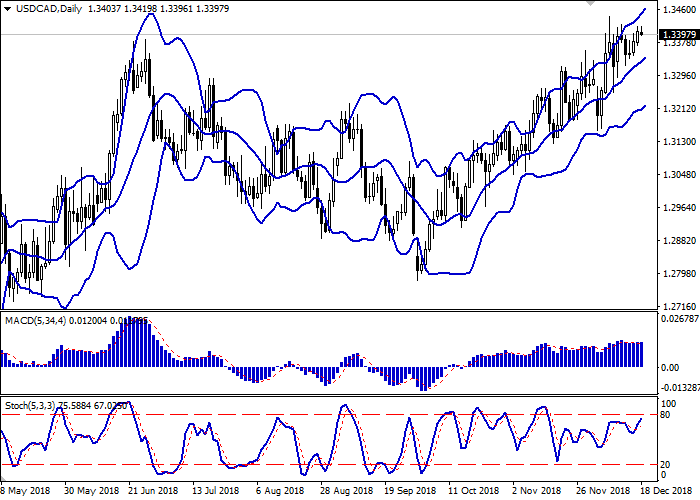
Bollinger Bands in D1 chart show stable growth. The price range expands, freeing a path to new local highs for the "bulls". MACD histogram shows unsteady dynamics keeping a weak buy signal (being located above the signal line). Stochastic retains an upward direction, but is located in close proximity to its maximum levels, which signals about the overbought instrument.
Existing long positions should be kept until the situation clears up.
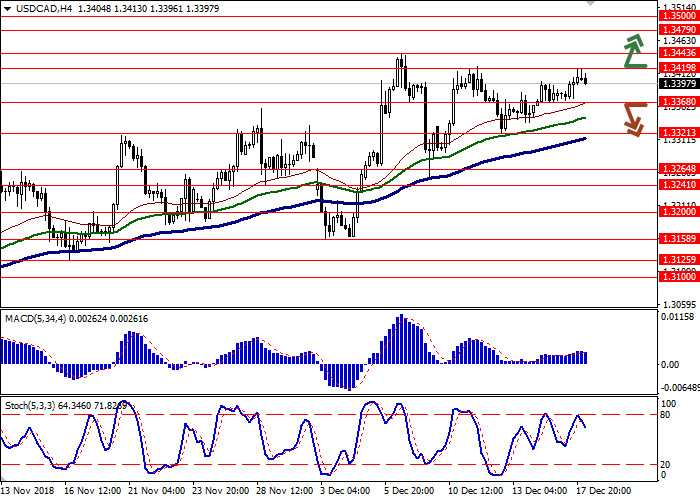
Resistance levels: 1.3419, 1.3443, 1.3479, 1.3500.
Support levels: 1.3368, 1.3321, 1.3264, 1.3241.
Trading tips
To open long positions, one can rely on the breakout of 1.3419. Take profit — 1.3500. Stop loss — 1.3380. Implementation period: 1-2 days.
The return of "bearish" trend with the breakdown of 1.3368 may become a signal to resume sales with target at 1.3264 or 1.3241. Stop loss — 1.3400. Implementation period: 2-3 days.
USD rose against CAD on Monday, continuing to develop the "bullish" momentum that emerged at the end of the last trading week.
Against the background of a half-empty macroeconomic calendar at the beginning of the new week, investor attention was focused on fairly strong statistics on the volume of US industrial production, published last Friday. In November, the indicator rose by 0.6% after a decline by 0.2% a month earlier. Today, the bullish impulse has somewhat weakened, as traders pay attention to weak data on business activity and the upcoming Fed meeting, after which the regulator may take a pause in the interest rate increase cycle. Also, investors expect tomorrow's publication of a block of statistics on consumer inflation from Canada.
NY Empire State Manufacturing Index in December showed a decrease from 23.30 to 10.90 points, which was noticeably worse than analytical forecast of 20.10 points.
Support and resistance
Bollinger Bands in D1 chart show stable growth. The price range expands, freeing a path to new local highs for the "bulls". MACD histogram shows unsteady dynamics keeping a weak buy signal (being located above the signal line). Stochastic retains an upward direction, but is located in close proximity to its maximum levels, which signals about the overbought instrument.
Existing long positions should be kept until the situation clears up.
Resistance levels: 1.3419, 1.3443, 1.3479, 1.3500.
Support levels: 1.3368, 1.3321, 1.3264, 1.3241.
Trading tips
To open long positions, one can rely on the breakout of 1.3419. Take profit — 1.3500. Stop loss — 1.3380. Implementation period: 1-2 days.
The return of "bearish" trend with the breakdown of 1.3368 may become a signal to resume sales with target at 1.3264 or 1.3241. Stop loss — 1.3400. Implementation period: 2-3 days.


No comments:
Write comments