
GBP/USD: general analysis
17 December 2018, 12:52
| Scenario | |
|---|---|
| Timeframe | Intraday |
| Recommendation | SELL STOP |
| Entry Point | 1.2560 |
| Take Profit | 1.2507 |
| Stop Loss | 1.2590 |
| Key Levels | 1.2476, 1.2507, 1.2528, 1.2562, 1.2611, 1.2637, 1.2658, 1.2685 |
| Alternative scenario | |
|---|---|
| Recommendation | BUY STOP |
| Entry Point | 1.2611 |
| Take Profit | 1.2685 |
| Stop Loss | 1.2580 |
| Key Levels | 1.2476, 1.2507, 1.2528, 1.2562, 1.2611, 1.2637, 1.2658, 1.2685 |
Current trend
On Friday, the GBP/USD pair fell under the pressure of the situation with Brexit, and then strengthened after the publication of mixed macroeconomic data from the United States.
Prime Minister Theresa May visited Brussels and the EU summit, where she unsuccessfully tried to get new concessions in a deal with the European Union. It was also noted that the European Union is ready to begin negotiations on trade with the United Kingdom as soon as it leaves its structure in March of next year. Thus, the chances for a tough Brexit for the UK continue to rise.
Published on Friday, statistics from the United States was mixed. The business activity index in the services sector fell to 53.4 points in December from 54.7 points a month earlier. The volume of industrial production in monthly terms rose to 0.6% in November from -0.2% a month earlier, and in annual terms dropped to 3.9% in the same period from 4.1% last month. The volume of retail sales was better than forecasts at the level of 0.1% and amounted to 0.2% in November against 1.1% last month.
Today, traders should pay attention to the publication of the index of business activity in the manufacturing sector of the New York Federal Reserve Bank (15.30 GMT+2), according to the preliminary forecast, a decline is expected in December, which may affect the dollar. Moderate volatility expected in the market
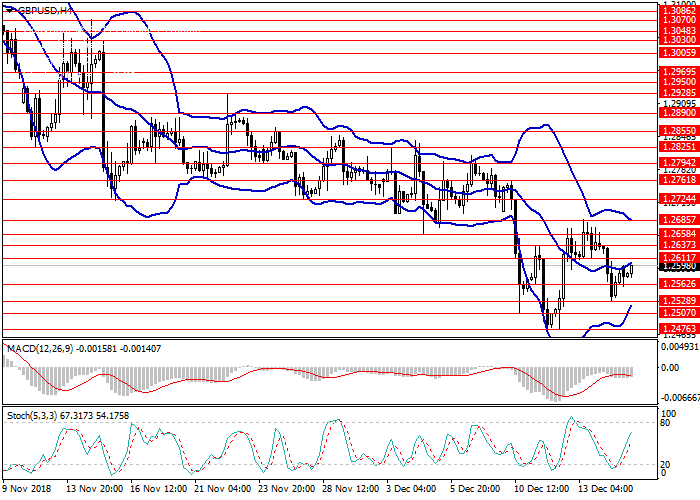
Support and resistance
On the 4-hour chart, the tool was corrected to the middle line of the Bollinger Bands, the downtrend is still strong. The MACD histogram is in the negative zone and keeps a sell signal.
Support levels: 1.2562, 1.2528, 1.2507, 1.2476.
Resistance levels: 1.2611, 1.2637, 1.2658, 1.2685.
Trading tips
Short positions can be opened at 1.2560 with a target at 1.2507 and a stop loss at 1.2590.
Long positions will become relevant at 1.2611 with a target at 1.2685 and a stop loss at 1.2580.
Duration: 1-3 days.
On Friday, the GBP/USD pair fell under the pressure of the situation with Brexit, and then strengthened after the publication of mixed macroeconomic data from the United States.
Prime Minister Theresa May visited Brussels and the EU summit, where she unsuccessfully tried to get new concessions in a deal with the European Union. It was also noted that the European Union is ready to begin negotiations on trade with the United Kingdom as soon as it leaves its structure in March of next year. Thus, the chances for a tough Brexit for the UK continue to rise.
Published on Friday, statistics from the United States was mixed. The business activity index in the services sector fell to 53.4 points in December from 54.7 points a month earlier. The volume of industrial production in monthly terms rose to 0.6% in November from -0.2% a month earlier, and in annual terms dropped to 3.9% in the same period from 4.1% last month. The volume of retail sales was better than forecasts at the level of 0.1% and amounted to 0.2% in November against 1.1% last month.
Today, traders should pay attention to the publication of the index of business activity in the manufacturing sector of the New York Federal Reserve Bank (15.30 GMT+2), according to the preliminary forecast, a decline is expected in December, which may affect the dollar. Moderate volatility expected in the market
Support and resistance
On the 4-hour chart, the tool was corrected to the middle line of the Bollinger Bands, the downtrend is still strong. The MACD histogram is in the negative zone and keeps a sell signal.
Support levels: 1.2562, 1.2528, 1.2507, 1.2476.
Resistance levels: 1.2611, 1.2637, 1.2658, 1.2685.
Trading tips
Short positions can be opened at 1.2560 with a target at 1.2507 and a stop loss at 1.2590.
Long positions will become relevant at 1.2611 with a target at 1.2685 and a stop loss at 1.2580.
Duration: 1-3 days.


No comments:
Write comments