
Brent Crude Oil: general review
20 December 2018, 11:23
| Scenario | |
|---|---|
| Timeframe | Intraday |
| Recommendation | SELL |
| Entry Point | 55.64 |
| Take Profit | 54.68 |
| Stop Loss | 56.00 |
| Key Levels | 54.68, 55.46, 56.25, 57.03, 57.81, 58.59 |
| Alternative scenario | |
|---|---|
| Recommendation | BUY STOP |
| Entry Point | 57.10 |
| Take Profit | 57.80, 58.00 |
| Stop Loss | 56.80 |
| Key Levels | 54.68, 55.46, 56.25, 57.03, 57.81, 58.59 |
Current trend
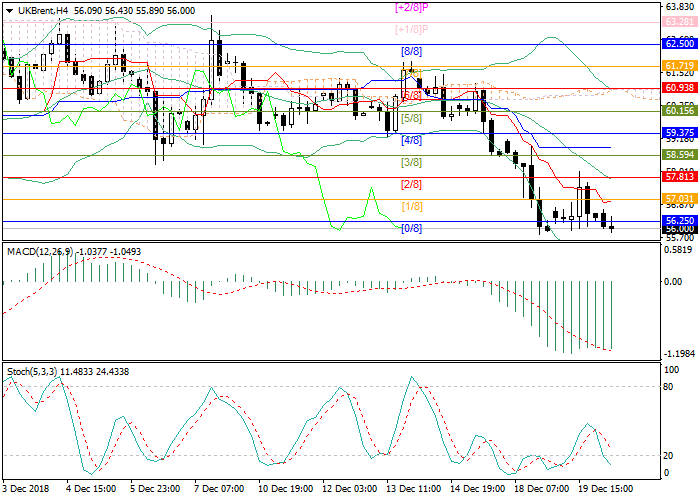
Oil quotes show negative dynamics having reached the level of 56.03, the minimum value for the last 14 months.
Published yesterday, official data from the US Department of Energy, indicating a reduction in oil reserves by 0.497M barrels for the week, could not support the Brent rate. Experts predicted a more significant decrease in the amount of 2.437M barrels for the week. The pressure on prices is exerted by concerns regarding oversupply in the oil market. The new OPEC agreement to reduce oil production will come into force only next month and currently the level of oil production in such countries as the USA, Saudi Arabia and the Russian Federation is at a high level. Also, additional pressure on prices is exerted by the general strengthening of USD in connection with the decision of the US Fed to raise the interest rate and to continue tightening monetary policy in 2019.
Support and resistance
Technical indicators show that downward movement potential is preserved. Bollinger Bands and Stochastic are directed downwards. MACD histogram is stable in the negative zone. One may speak about downward movement continuation after the price consolidates below the support level of 56.25. In this case, the decline may continue to the level of 55.46. If the price fails to consolidate below the level of 56.25, then an upward correction is likely to develop with the main target at 57.81, corresponding to the center line of Bollinger Bands.
Resistance levels: 57.03, 57.81, 58.59.
Support levels: 56.25, 55.46, 54.68.
Trading tips
Short positions may be opened from the current level with target at 54.68 and stop loss at 56.00.
Long positions may be opened above the level of 57.03 with target at 57.80–58.00 and stop loss at 56.80.


No comments:
Write comments