
AUD/USD: technical analysis
19 December 2018, 11:05
| Scenario | |
|---|---|
| Timeframe | Intraday |
| Recommendation | BUY |
| Entry Point | 0.7194 |
| Take Profit | 0.7245 |
| Stop Loss | 0.7164 |
| Key Levels | 0.7127, 0.7151, 0.7164, 0.7177, 0.7203, 0.7246, 0.7275, 0.7300, 0.7344, 0.7392 |
| Alternative scenario | |
|---|---|
| Recommendation | SELL STOP |
| Entry Point | 0.7150 |
| Take Profit | 0.7100 |
| Stop Loss | 0.7180 |
| Key Levels | 0.7127, 0.7151, 0.7164, 0.7177, 0.7203, 0.7246, 0.7275, 0.7300, 0.7344, 0.7392 |
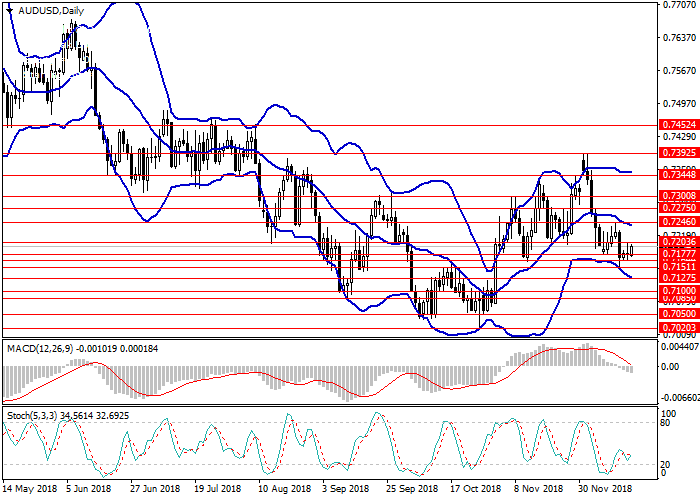
AUD/USD, D1
D1 chart shows the correction of the downward movement. The pair is trading between the lower and the center lines of Bollinger Bands; the price range is widened, which indicates a possible continuation of the downtrend. MACD histogram is in the negative zone and its volumes are minimal; the signal line is about to cross the zero level from above, after which a signal to open short positions will be formed. Stochastic is on the border with the oversold zone, the signal line is directed horizontally.
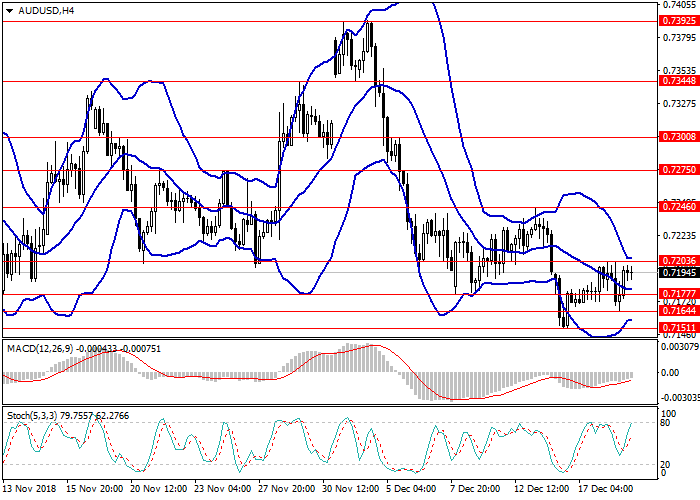
AUD/USD, H4
On the H4 chart, the instrument moves in the lateral channel within the boundaries formed by Bollinger Bands and the price range is narrowed. MACD histogram is in the negative zone keeping a signal for the opening of short positions. Stochastic is in the neutral area, and the lines of the oscillator are directed upwards.
Key levels
Resistance levels: 0.7203, 0.7246, 0.7275, 0.7300, 0.7344, 0.7392.
Support levels: 0.7177, 0.7164, 0.7151, 0.7127.
Trading tips
Long positions may be opened from the current level with target at 0.7245 and stop loss at 0.7164.
Short positions may be opened from the level of 0.7150 with target at 0.7100. Stop loss – 0.7180.
Implementation time: 1-3 days.
D1 chart shows the correction of the downward movement. The pair is trading between the lower and the center lines of Bollinger Bands; the price range is widened, which indicates a possible continuation of the downtrend. MACD histogram is in the negative zone and its volumes are minimal; the signal line is about to cross the zero level from above, after which a signal to open short positions will be formed. Stochastic is on the border with the oversold zone, the signal line is directed horizontally.
AUD/USD, H4
On the H4 chart, the instrument moves in the lateral channel within the boundaries formed by Bollinger Bands and the price range is narrowed. MACD histogram is in the negative zone keeping a signal for the opening of short positions. Stochastic is in the neutral area, and the lines of the oscillator are directed upwards.
Key levels
Resistance levels: 0.7203, 0.7246, 0.7275, 0.7300, 0.7344, 0.7392.
Support levels: 0.7177, 0.7164, 0.7151, 0.7127.
Trading tips
Long positions may be opened from the current level with target at 0.7245 and stop loss at 0.7164.
Short positions may be opened from the level of 0.7150 with target at 0.7100. Stop loss – 0.7180.
Implementation time: 1-3 days.


No comments:
Write comments