
GBP/USD: general review
30 November 2018, 14:00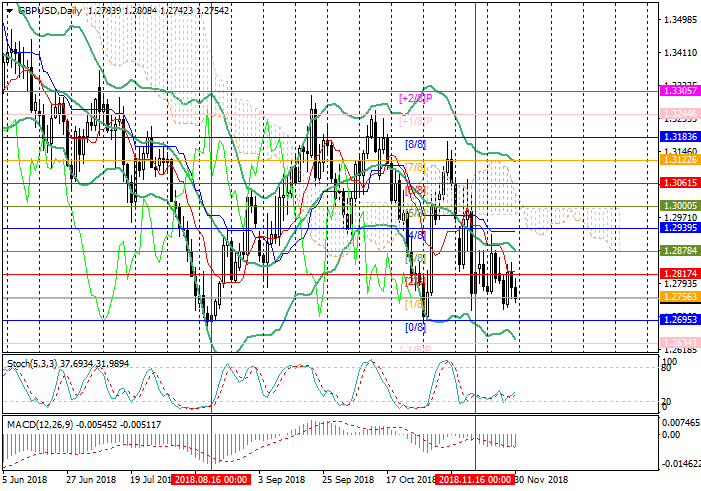
| Scenario | |
|---|---|
| Timeframe | Weekly |
| Recommendation | SELL STOP |
| Entry Point | 1.2750 |
| Take Profit | 1.2695, 1.2634 |
| Stop Loss | 1.2800 |
| Key Levels | 1.2634, 1.2695, 1.2756, 1.2817, 1.2878, 1.2940 |
| Alternative scenario | |
|---|---|
| Recommendation | BUY STOP |
| Entry Point | 1.2820 |
| Take Profit | 1.2878, 1.2940 |
| Stop Loss | 1.2790 |
| Key Levels | 1.2634, 1.2695, 1.2756, 1.2817, 1.2878, 1.2940 |
Current trend
On Friday, the pair dropped to 1.2756 (Murrey [1/8]). USD was supported by the FOMC protocols stating that the regulator considers another increase in rates to be necessary in December.
Today, investors are focused on Brexit and the G20 summit, within which a meeting between US President Donald Trump and Chinese President Xi Jinping is to be held. There would be no breakthrough and serious agreements, however, basic documents may be signed, thus, further negotiations will be possible.
British Prime Minister Theresa May continues to convince MPs and the public to approve the Brexit deal. Like her opponents say, May switched to the tactics of “frightening”, explaining that the exit without a deal means significant losses for the economy. This is confirmed by the latest economic reports. According to the Bank of England, a "divorce without a deal" could result in a decrease in the economy by 8% in the first months after the withdrawal from the EU.
Support and resistance
The level of 1.2756 (Murrey [1/8]) seems to be the key for the "bears". If the price consolidates below it, a decrease to 1.2695 (Murrуy [0/8]) and 1.2634 (Murrey [-1/8]) is possible. After the breakout of 1.2817 (Murrey [2/8]) the price may go up, to 1.2878 (Murrey [3/8], the midline of Bollinger Bands) and 1.2940 (Murrey [4/8]).
Technical indicators do not provide a clear signal: Bollinger Bands are reversing down, Stochastic is reversing up, and MACD histogram is stable in the negative zone.
Support levels: 1.2756, 1.2695, 1.2634.
Resistance levels: 1.2817, 1.2878, 1.2940.

Trading tips
Short positions may be opened below 1.2756 with targets at 1.2695, 1.2634 and stop loss at 1.2800.
Long positions may be opened above 1.2817 with targets at 1.2878, 1.2940 and stop loss at 1.2790.
Implementation period: 4-5 days.
On Friday, the pair dropped to 1.2756 (Murrey [1/8]). USD was supported by the FOMC protocols stating that the regulator considers another increase in rates to be necessary in December.
Today, investors are focused on Brexit and the G20 summit, within which a meeting between US President Donald Trump and Chinese President Xi Jinping is to be held. There would be no breakthrough and serious agreements, however, basic documents may be signed, thus, further negotiations will be possible.
British Prime Minister Theresa May continues to convince MPs and the public to approve the Brexit deal. Like her opponents say, May switched to the tactics of “frightening”, explaining that the exit without a deal means significant losses for the economy. This is confirmed by the latest economic reports. According to the Bank of England, a "divorce without a deal" could result in a decrease in the economy by 8% in the first months after the withdrawal from the EU.
Support and resistance
The level of 1.2756 (Murrey [1/8]) seems to be the key for the "bears". If the price consolidates below it, a decrease to 1.2695 (Murrуy [0/8]) and 1.2634 (Murrey [-1/8]) is possible. After the breakout of 1.2817 (Murrey [2/8]) the price may go up, to 1.2878 (Murrey [3/8], the midline of Bollinger Bands) and 1.2940 (Murrey [4/8]).
Technical indicators do not provide a clear signal: Bollinger Bands are reversing down, Stochastic is reversing up, and MACD histogram is stable in the negative zone.
Support levels: 1.2756, 1.2695, 1.2634.
Resistance levels: 1.2817, 1.2878, 1.2940.
Trading tips
Short positions may be opened below 1.2756 with targets at 1.2695, 1.2634 and stop loss at 1.2800.
Long positions may be opened above 1.2817 with targets at 1.2878, 1.2940 and stop loss at 1.2790.
Implementation period: 4-5 days.


No comments:
Write comments