
Brent Crude Oil: technical analysis
30 November 2018, 11:45
| Scenario | |
|---|---|
| Timeframe | Weekly |
| Recommendation | BUY STOP |
| Entry Point | 62.50 |
| Take Profit | 64.50, 66.75 |
| Stop Loss | 61.00 |
| Key Levels | 53.65, 57.50, 58.60, 62.50, 64.50, 66.75 |
| Alternative scenario | |
|---|---|
| Recommendation | SELL STOP |
| Entry Point | 57.50 |
| Take Profit | 53.65 |
| Stop Loss | 58.60 |
| Key Levels | 53.65, 57.50, 58.60, 62.50, 64.50, 66.75 |
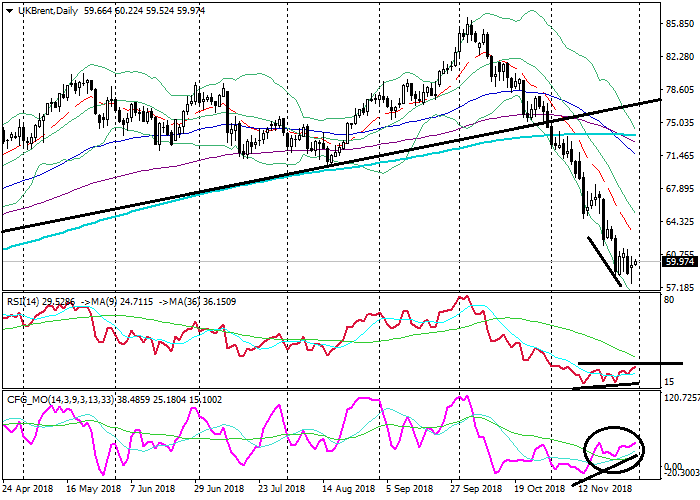
Brent Crude Oil, D1
On the daily chart, the instrument is trading in the lower Bollinger band. The price remains below its moving averages that are directed down. The RSI is testing from below the border of the oversold zone, having formed a Bullish divergence with the price. The Composite is growing, having broken out its longer MA.
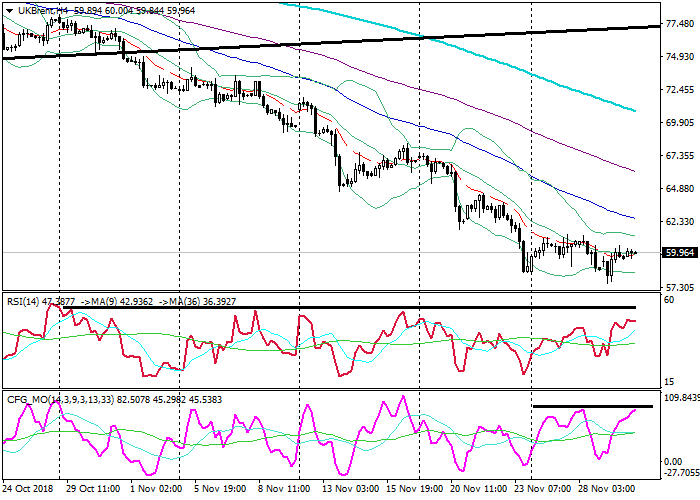
Brent Crude Oil, H4
On the 4-hour chart, the instrument is trading on the middle MA of the Bollinger Bands. The price remains below the EMA65, EMA130 and SMA200 that are directed down. The RSI is about to test its strong resistance region. The Composite is testing its most recent resistance as well.
Key levels
Support levels: 58.60 (local lows), 57.50 (January 2017 highs), 53.65 (October 2016 highs).
Resistance levels: 62.50 (local highs), 64.50 (local highs), 66.75 (local highs).
Trading tips
The price is testing its strong support near 57.50. There is a chance of an upward correction, while its breakdown would lead to a fall continuation.
Long positions can be opened from the level of 62.50 with targets at 64.50, 66.75 and stop-loss at 61.00. Validity – 3-5 days.
Short positions can be opened from the level of 57.50 with the target at 53.65 and stop-loss at 58.60. Validity – 3-5 days.
On the daily chart, the instrument is trading in the lower Bollinger band. The price remains below its moving averages that are directed down. The RSI is testing from below the border of the oversold zone, having formed a Bullish divergence with the price. The Composite is growing, having broken out its longer MA.
Brent Crude Oil, H4
On the 4-hour chart, the instrument is trading on the middle MA of the Bollinger Bands. The price remains below the EMA65, EMA130 and SMA200 that are directed down. The RSI is about to test its strong resistance region. The Composite is testing its most recent resistance as well.
Key levels
Support levels: 58.60 (local lows), 57.50 (January 2017 highs), 53.65 (October 2016 highs).
Resistance levels: 62.50 (local highs), 64.50 (local highs), 66.75 (local highs).
Trading tips
The price is testing its strong support near 57.50. There is a chance of an upward correction, while its breakdown would lead to a fall continuation.
Long positions can be opened from the level of 62.50 with targets at 64.50, 66.75 and stop-loss at 61.00. Validity – 3-5 days.
Short positions can be opened from the level of 57.50 with the target at 53.65 and stop-loss at 58.60. Validity – 3-5 days.


No comments:
Write comments