
WTI Crude Oil: general review
04 September 2018, 13:27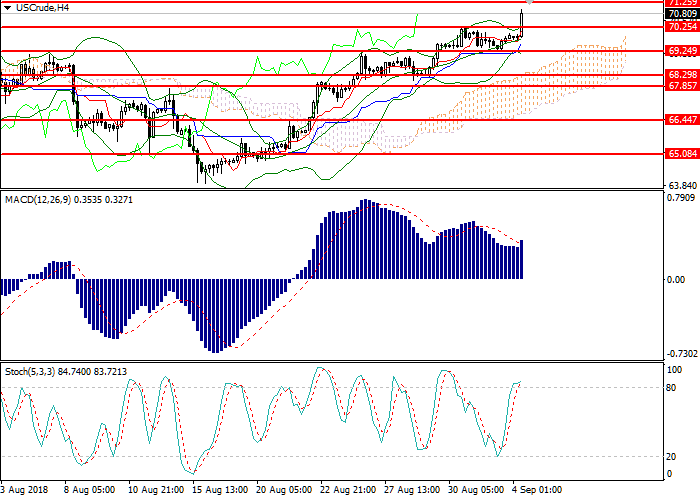
| Scenario | |
|---|---|
| Timeframe | Intraday |
| Recommendation | BUY |
| Entry Point | 70.71 |
| Take Profit | 71.90, 72.30 |
| Stop Loss | 70.15 |
| Key Levels | 65.08, 66.44, 67.85, 68.30, 69.25, 70.25, 71.26, 72.36, 73.31, 74.32 |
| Alternative scenario | |
|---|---|
| Recommendation | SELL STOP |
| Entry Point | 69.65 |
| Take Profit | 68.30 |
| Stop Loss | 70.15 |
| Key Levels | 65.08, 66.44, 67.85, 68.30, 69.25, 70.25, 71.26, 72.36, 73.31, 74.32 |
Current trend
WTI crude oil strengthened amid possible supply disruptions due to the tropical storm "Gordon".
Anadarko Petroleum evacuated its employees and froze operations in the Gulf of Mexico. Quotes are also supported by the reduction of Iranian oil supplies and the news that a number of Japanese companies refused to cooperate with the Islamic Republic. In August, Iran exported only 2.1 million barrels of oil products per day, which is the minimum since March 2016. The suspension of oil purchases in Iran is being considered by Japanese JXTG Holdings, Idemitsu Kosan and several others. Friday Baker Hughes US Oil Rig Count data grew from 860 to 862 units, but it did not pressured the market.
Today, the instrument may be influenced by data on US Markit Manufacturing PMI, as well as the index of gradual acceleration of inflation (at 16:00 GMT+2). Tomorrow (at 22:30 GMT+2), API will publish data on the weekly change in reserves of commercial oil in the US. Quotes can overcome 72.50 before the end of the week.
Support and resistance
On D1 chart, the instrument broke out the upper border of Bollinger Bands and continued to grow. The indicator is directed up, the price range has expanded, indicating a further growth. MACD histogram is in positive zone, keeping the buy signal. Stochastic entered the overbought area, so a sell signal can be formed in 1-2 days.
Support levels: 65.08, 66.44, 67.85, 68.30, 69.25, 70.25.
Resistance levels: 71.26, 72.36, 73.31, 74.32.

Trading tips
Long positions may be opened from the current level with targets at 71.90, 72.30 and stop loss at 70.15. Implementation time: 1-3 days.
Short positions may be opened below the level of 69.70 with the target at 68.30 and stop loss at 70.15. Implementation time: 1-3 days.
WTI crude oil strengthened amid possible supply disruptions due to the tropical storm "Gordon".
Anadarko Petroleum evacuated its employees and froze operations in the Gulf of Mexico. Quotes are also supported by the reduction of Iranian oil supplies and the news that a number of Japanese companies refused to cooperate with the Islamic Republic. In August, Iran exported only 2.1 million barrels of oil products per day, which is the minimum since March 2016. The suspension of oil purchases in Iran is being considered by Japanese JXTG Holdings, Idemitsu Kosan and several others. Friday Baker Hughes US Oil Rig Count data grew from 860 to 862 units, but it did not pressured the market.
Today, the instrument may be influenced by data on US Markit Manufacturing PMI, as well as the index of gradual acceleration of inflation (at 16:00 GMT+2). Tomorrow (at 22:30 GMT+2), API will publish data on the weekly change in reserves of commercial oil in the US. Quotes can overcome 72.50 before the end of the week.
Support and resistance
On D1 chart, the instrument broke out the upper border of Bollinger Bands and continued to grow. The indicator is directed up, the price range has expanded, indicating a further growth. MACD histogram is in positive zone, keeping the buy signal. Stochastic entered the overbought area, so a sell signal can be formed in 1-2 days.
Support levels: 65.08, 66.44, 67.85, 68.30, 69.25, 70.25.
Resistance levels: 71.26, 72.36, 73.31, 74.32.
Trading tips
Long positions may be opened from the current level with targets at 71.90, 72.30 and stop loss at 70.15. Implementation time: 1-3 days.
Short positions may be opened below the level of 69.70 with the target at 68.30 and stop loss at 70.15. Implementation time: 1-3 days.


No comments:
Write comments