USD/CAD: the instrument is in the correction
07 September 2018, 10:12
| Scenario | |
|---|---|
| Timeframe | Intraday |
| Recommendation | BUY |
| Entry Point | 1.3141 |
| Take Profit | 1.3200, 1.3234 |
| Stop Loss | 1.3105 |
| Key Levels | 1.2961, 1.3000, 1.3055, 1.3100, 1.3134, 1.3173, 1.3200, 1.3224 |
| Alternative scenario | |
|---|---|
| Recommendation | SELL STOP |
| Entry Point | 1.3095 |
| Take Profit | 1.3050, 1.3030, 1.3000 |
| Stop Loss | 1.3140, 1.3150 |
| Key Levels | 1.2961, 1.3000, 1.3055, 1.3100, 1.3134, 1.3173, 1.3200, 1.3224 |
Current trend
Yesterday, USD declined within the correction against CAD, having previously updated its highs since July 20. The development of the "bearish" dynamics was due to poor US ADP employment report. However, Canadian data also did not met the expectations. July Building Permits number fell by 0.1% MoM after a decrease of 1.3% MoM last month. Analysts had expected the growth rate of 1.3% MoM.
Today, American and Canadian labor market data will be releases, and the Canadian reports are expected to be poor. The unemployment rate can increase from 5.8% to 5.9%. The number of employed in August could rise by only 5K after an increase of 54.1K last month.
Support and resistance
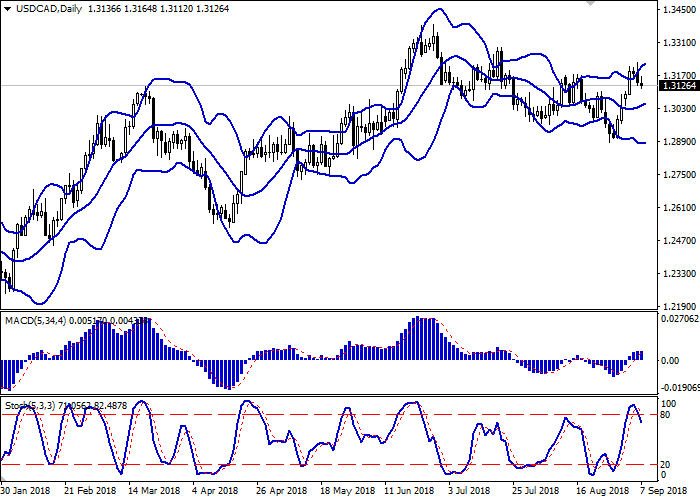
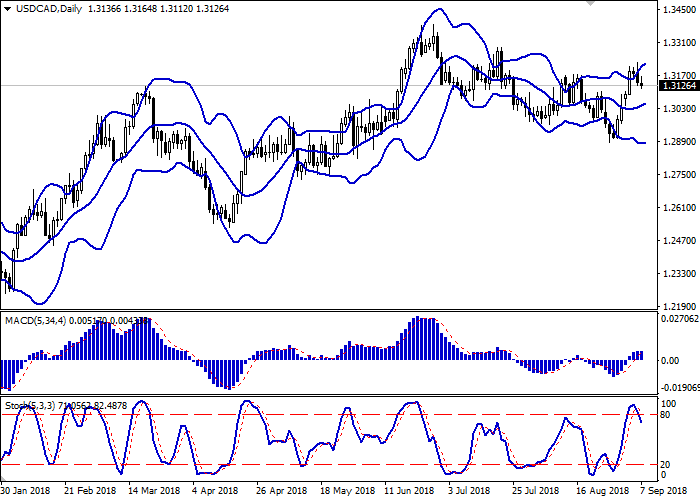
On the daily chart, Bollinger bands are moderately growing. The price range expands from above, letting the "bulls" renew local highs. MACD indicator slows growth, keeping the previous buy signal (the histogram is above the signal line). Stochastic reversed downwards, reaching its maximum. Current indicators reflect that USD is overbought in the short term.
The development of a corrective "bearish" trend is possible in the short and/or ultra-short term.
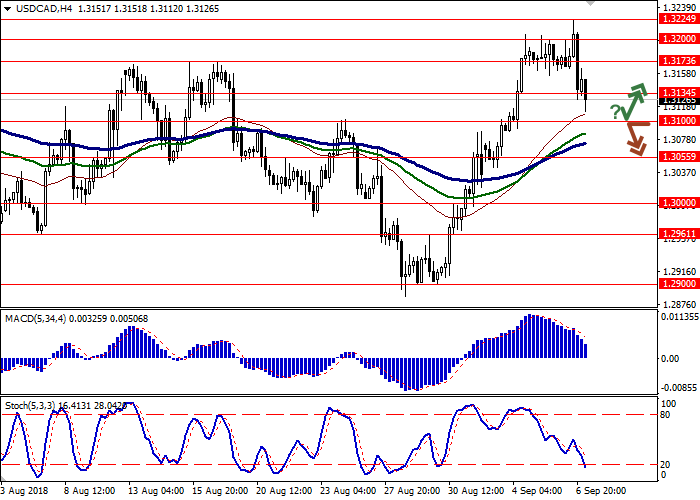
Resistance levels: 1.3134, 1.3173, 1.3200, 1.3224.
Support levels: 1.3100, 1.3055, 1.3000, 1.2961.


Trading tips
Long positions can be opened after a rebound from the level of 1.3100 and breakout of the level of 1.3134 with the target at 1.3200 or 1.3234 and stop loss 1.3105.
Short positions can be opened after the breakdown of the level of 1.3100 with the targets at 1.3050 or 1.3030–1.3000 and stop loss 1.3140–1.3150.
Implementation period: 2–3 days.
Yesterday, USD declined within the correction against CAD, having previously updated its highs since July 20. The development of the "bearish" dynamics was due to poor US ADP employment report. However, Canadian data also did not met the expectations. July Building Permits number fell by 0.1% MoM after a decrease of 1.3% MoM last month. Analysts had expected the growth rate of 1.3% MoM.
Today, American and Canadian labor market data will be releases, and the Canadian reports are expected to be poor. The unemployment rate can increase from 5.8% to 5.9%. The number of employed in August could rise by only 5K after an increase of 54.1K last month.
Support and resistance
On the daily chart, Bollinger bands are moderately growing. The price range expands from above, letting the "bulls" renew local highs. MACD indicator slows growth, keeping the previous buy signal (the histogram is above the signal line). Stochastic reversed downwards, reaching its maximum. Current indicators reflect that USD is overbought in the short term.
The development of a corrective "bearish" trend is possible in the short and/or ultra-short term.
Resistance levels: 1.3134, 1.3173, 1.3200, 1.3224.
Support levels: 1.3100, 1.3055, 1.3000, 1.2961.


Trading tips
Long positions can be opened after a rebound from the level of 1.3100 and breakout of the level of 1.3134 with the target at 1.3200 or 1.3234 and stop loss 1.3105.
Short positions can be opened after the breakdown of the level of 1.3100 with the targets at 1.3050 or 1.3030–1.3000 and stop loss 1.3140–1.3150.
Implementation period: 2–3 days.


No comments:
Write comments