
NZD/USD: New Zealand dollar is under pressure
05 September 2018, 10:11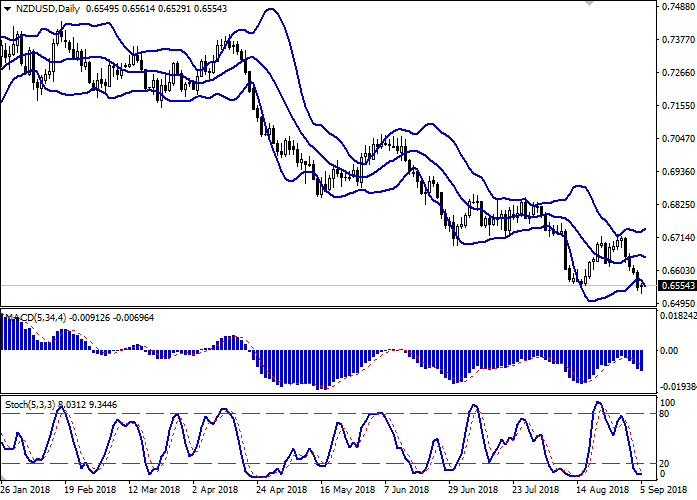
| Scenario | |
|---|---|
| Timeframe | Intraday |
| Recommendation | BUY STOP |
| Entry Point | 0.6565, 0.6575 |
| Take Profit | 0.6630, 0.6650 |
| Stop Loss | 0.6530, 0.6520 |
| Key Levels | 0.6500, 0.6529, 0.6543, 0.6560, 0.6592, 0.6618, 0.6650 |
| Alternative scenario | |
|---|---|
| Recommendation | SELL STOP |
| Entry Point | 0.6520 |
| Take Profit | 0.6500, 0.6480, 0.6470 |
| Stop Loss | 0.6560 |
| Key Levels | 0.6500, 0.6529, 0.6543, 0.6560, 0.6592, 0.6618, 0.6650 |
Current trend
Yesterday, NZD fell significantly against USD, renewing the minimum since February 2016.
Investors are focused on American foreign trade. Negotiations are going between the United States and Canada on the accession of the latter to the new terms of the NAFTA (agreed earlier by the US and Mexico). However, there's no compromise yet. The market also expects that in the near future, President Trump can introduce increased duties on Chinese goods with a total value of another USD 200 billion. This, surely, will not remain without the answer of the PRC, and in the end, both leading world economies will suffer.
On Tuesday, USD was also supported by US releases. August Manufacturing PMI increased from 54.5 to 54.7 points. The corresponding ISM index accelerated even more: from 58.1 to 61.3 points.
Support and resistance
On the daily chart, Bollinger bands move horizontally. The price range is expanding, but not as fast as the "bearish" trend develops. MACD indicator decreases, keeping a strong sell signal (the histogram is below the signal line). Stochastic reached its lows and reversed horizontally. The indicator reflects than NZD is oversold in the short term.
The development of corrective growth is possible.
Resistance levels: 0.6560, 0.6592, 0.6618, 0.6650.
Support levels: 0.6543, 0.6529, 0.6500.
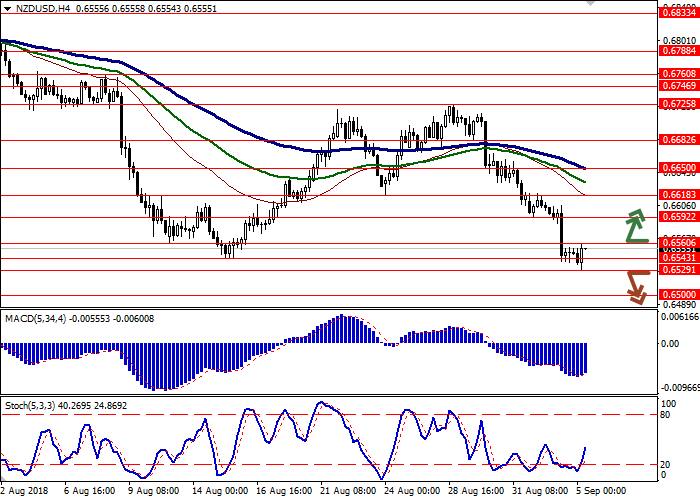

Trading tips
Long positions can be opened after the breakout of the levels 0.6560–0.6570 with the targets at 0.6630–0.6650 and stop loss 0.6530–0.6520.
Short positions can be opened after the breakdown of the level 0.6529 with the targets at 0.6500 or 0.6480–0.6470 and stop loss 0.6560.
Implementation period: 2–3 days.
Yesterday, NZD fell significantly against USD, renewing the minimum since February 2016.
Investors are focused on American foreign trade. Negotiations are going between the United States and Canada on the accession of the latter to the new terms of the NAFTA (agreed earlier by the US and Mexico). However, there's no compromise yet. The market also expects that in the near future, President Trump can introduce increased duties on Chinese goods with a total value of another USD 200 billion. This, surely, will not remain without the answer of the PRC, and in the end, both leading world economies will suffer.
On Tuesday, USD was also supported by US releases. August Manufacturing PMI increased from 54.5 to 54.7 points. The corresponding ISM index accelerated even more: from 58.1 to 61.3 points.
Support and resistance
On the daily chart, Bollinger bands move horizontally. The price range is expanding, but not as fast as the "bearish" trend develops. MACD indicator decreases, keeping a strong sell signal (the histogram is below the signal line). Stochastic reached its lows and reversed horizontally. The indicator reflects than NZD is oversold in the short term.
The development of corrective growth is possible.
Resistance levels: 0.6560, 0.6592, 0.6618, 0.6650.
Support levels: 0.6543, 0.6529, 0.6500.
Trading tips
Long positions can be opened after the breakout of the levels 0.6560–0.6570 with the targets at 0.6630–0.6650 and stop loss 0.6530–0.6520.
Short positions can be opened after the breakdown of the level 0.6529 with the targets at 0.6500 or 0.6480–0.6470 and stop loss 0.6560.
Implementation period: 2–3 days.


No comments:
Write comments